如何使用xtable进行单元格着色

7

我有一个.RMD文件中的表格,我想使用条件格式在PDF中呈现它。目前我正在使用pandoc。如何使用xtable实现这一点?

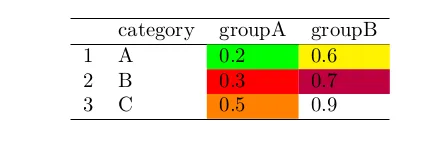
 table = data.frame(category = c("A","B","C"), groupA = c(.2,.3,.5), groupB= c(.6,.7,.9))
 table
 pandoc.table(table,split.table = Inf,keep.line.breaks = TRUE)

----------------------------
 category   groupA   groupB 
---------- -------- --------
    A        0.2      0.6   

    B        0.3      0.7   

    C        0.5      0.9   
----------------------------

我该如何使用条件格式化为“groupA”和“groupB”列的单元格上色呢?
>0 and <= .2    = "green"
>.2 and <= .3    = "red"
>.3 and <= .4    = "blue"
>.4 and <= .5     = "orange"
>.5 and <= .6     = "yellow"
>.6 and <= .7     = "black"
>.7 and <= .8     = "brown"
>.8  = "white"
2个回答

8
您可以使用 LaTeX 代码将相关的表格条目包装起来(参见此处),然后再对 xtable 的结果进行清理。
示例:
---
header-includes:
   - \usepackage{xcolor, colortbl}
output:
    pdf_document
---

```{r, results="asis"}

library(xtable)
# Your data
tab = data.frame(category = c("A","B","C"), groupA = c(.2,.3,.5), groupB= c(.6,.7,.9))

# Function to cut your data, and assign colour to each range
f <- function(x) cut(x, c(0, 0.2, 0.3, 0.4, 0.5, 0.6, 0.7, 0.8, Inf), 
                      labels=c("green", "red", "blue", "orange", "yellow", "purple", "brown", "white"),
                      include.lowest = FALSE, right = TRUE)

# Apply function to columns: this overwrites your data
tab[c("groupA", "groupB")] <- lapply(tab[c("groupA", "groupB")], function(x)
                                            paste0("\\cellcolor{", f(x), "}", x))
# Sanitise output 
print(xtable(tab), sanitize.text.function = identity)
```

它产生的是

在此输入图像描述


我遇到了这个错误!额外的对齐标签已被更改为\cr。 <最近读取> \endtemplate - user3022875
@user3022875;我只是将答案中的代码复制粘贴到一个新的.Rmd文件中,它按照预期运行了。您是否添加了任何内容,例如更改列数或对齐方式? - user20650

1

网页内容由stack overflow 提供, 点击上面的
可以查看英文原文,
原文链接