如何高效地将位于同一工作表中的多个Excel表格导入R列表?

3

任务

我想要以尽可能高效的方式将单个Excel工作表中的表格导入到R对象中(将其导入为list即可,因为我可以从那里获取其余计算)。

细节说明

这些表格实际上是Excel区域而不是Excel表格,但它们具有结构并且看起来像表格:以下是应该作为表格导入到R中的Excel区域示例:

enter image description here

这些区域(以表格形式)的长度不同,可以位于同一工作表的任何位置。

可再现示例

这里提供了一个玩具示例(.xlsx 文件):

我的尝试

下面是我撰写的将Excel表格导入R的代码。 这是低效的方法,因为需要在运行此代码将其导入到R的列表之前将所有Excel区域转换为表格:

library(purrr)
library(XLConnect)

wb <- loadWorkbook("example.xlsx")

tables <- map(1:100,function(x) tryCatch(readTable(wb,
                                         sheet = "Sheet1",
                                         table = paste0("Table",x)),
                                         error = function(e) NA)
              )

问题

是否有更好(更有效)的方法,可以通过将excel文件作为输入,使用R运行所有计算/转换,并将一个excel表格中的多个区域导入到一个R数据结构中。欢迎使用任何包!

非常感谢您提前的帮助。

2个回答

5

我不确定是否以最佳方式解决了类似问题,但在我的某个项目中,为了解决类似问题,我编写了一些实用函数来处理它。您可以在此处查看这些函数

拆分背后的逻辑是,每当存在只包含NA的行或列时,就会在该行或列上创建拆分。并且这个过程将进行一定次数。

无论如何,如果您加载了我编写的所有函数,您可以使用以下代码:

读取数据

library(tidyverse)
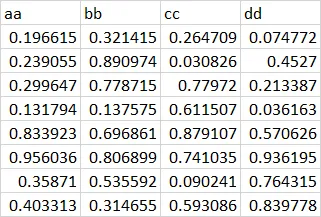
table_raw<- readxl::read_excel("example.xlsx",col_names = FALSE,col_types = "text")

显示数据形状

# This is a custom function I wrote
display_table_shape(table_raw)

enter image description here

将数据拆分为单独的数据框。
split_table <- table_raw %>%
    split_df(complexity = 2) # another custom function I wrote

在将原始数据框分割后,您可以使用for循环或map函数进行更多处理。

数据清洗

map(split_table, function(df){
    df <- df[-1,]
    set_1row_colname(df) %>% # another function I wrote
        mutate_all(as.numeric)
})

结果

[[1]]
# A tibble: 8 x 4
     aa    bb     cc     dd
  <dbl> <dbl>  <dbl>  <dbl>
1 0.197 0.321 0.265  0.0748
2 0.239 0.891 0.0308 0.453 
3 0.300 0.779 0.780  0.213 
4 0.132 0.138 0.612  0.0362
5 0.834 0.697 0.879  0.571 
6 0.956 0.807 0.741  0.936 
7 0.359 0.536 0.0902 0.764 
8 0.403 0.315 0.593  0.840 

[[2]]
# A tibble: 4 x 4
     aa    bb     cc      dd
  <dbl> <dbl>  <dbl>   <dbl>
1 0.136 0.347 0.603  0.542  
2 0.790 0.672 0.0808 0.795  
3 0.589 0.338 0.837  0.00968
4 0.513 0.766 0.553  0.189  

[[3]]
# A tibble: 8 x 4
      aa     bb    cc    dd
   <dbl>  <dbl> <dbl> <dbl>
1 0.995  0.105  0.106 0.530
2 0.372  0.306  0.190 0.609
3 0.508  0.987  0.585 0.233
4 0.0800 0.851  0.215 0.761
5 0.471  0.603  0.740 0.106
6 0.395  0.0808 0.571 0.266
7 0.908  0.739  0.245 0.141
8 0.534  0.313  0.663 0.824

[[4]]
# A tibble: 14 x 4
      aa     bb      cc     dd
   <dbl>  <dbl>   <dbl>  <dbl>
 1 0.225 0.993  0.0382  0.412 
 2 0.280 0.202  0.823   0.664 
 3 0.423 0.616  0.377   0.857 
 4 0.289 0.298  0.0418  0.410 
 5 0.919 0.932  0.882   0.668 
 6 0.568 0.561  0.600   0.832 
 7 0.341 0.210  0.351   0.0863
 8 0.757 0.962  0.484   0.677 
 9 0.275 0.0845 0.824   0.571 
10 0.187 0.512  0.884   0.612 
11 0.706 0.311  0.00610 0.463 
12 0.906 0.411  0.215   0.377 
13 0.629 0.317  0.0975  0.312 
14 0.144 0.644  0.906   0.353 

你需要加载的函数

# utility function to get rle as a named vector
vec_rle <- function(v){
    temp <- rle(v)
    out <- temp$values
    names(out) <- temp$lengths
    return(out)
}

# utility function to map table with their columns/rows in a bigger table
make_df_index <- function(v){
    table_rle <- vec_rle(v)
    divide_points <- c(0,cumsum(names(table_rle)))
    table_index <- map2((divide_points + 1)[1:length(divide_points)-1],
                        divide_points[2:length(divide_points)],
                        ~.x:.y)
    return(table_index[table_rle])
}

# split a large table in one direction if there are blank columns or rows
split_direction <- function(df,direction = "col"){
    if(direction == "col"){
        col_has_data <- unname(map_lgl(df,~!all(is.na(.x))))
        df_mapping <- make_df_index(col_has_data)
        out <- map(df_mapping,~df[,.x])
    } else if(direction == "row"){
        row_has_data <- df %>% 
            mutate_all(~!is.na(.x)) %>%
            as.matrix() %>% 
            apply(1,any)
        df_mapping <- make_df_index(row_has_data)
        out <- map(df_mapping,~df[.x,])
    }
    return(out)
}

# split a large table into smaller tables if there are blank columns or rows
# if you still see entire rows or columns missing. Please increase complexity
split_df <- function(df,showWarnig = TRUE,complexity = 1){
    if(showWarnig){
        warning("Please don't use first row as column names.")
    }

    out <- split_direction(df,"col")

    for(i in 1 :complexity){
        out <- out %>%
            map(~split_direction(.x,"row")) %>%
            flatten() %>%
            map(~split_direction(.x,"col")) %>%
            flatten()
    }
    return(out)

}

#display the rough shape of table in a sheet with multiple tables
display_table_shape <- function(df){
    colnames(df) <- 1:ncol(df)

    out <- df %>%
        map_df(~as.numeric(!is.na(.x))) %>%
        gather(key = "x",value = "value") %>%
        mutate(x = as.numeric(x)) %>%
        group_by(x) %>%
        mutate(y = -row_number()) %>%
        ungroup() %>%
        filter(value == 1) %>%
        ggplot(aes(x = x, y = y,fill = value)) +
        geom_tile(fill = "skyblue3") +
        scale_x_continuous(position = "top") +
        theme_void() +
        theme(legend.position="none",
              panel.border = element_rect(colour = "black", fill=NA, size=2))
    return(out)
}

# set first row as column names for a data frame and remove the original first row
set_1row_colname <- function(df){
    colnames(df) <- as.character(df[1,])
    out <- df[-1,]
    return(out)
}

不错的解决方案!谢谢你的分享。虽然它已经做得很好了,但我希望能在任何包内找到一些自定义函数来自动完成这个任务。如果没有更短的方法,我会使用这个。感激不尽! - Vitali Avagyan
换句话说,在一个工作表中读取多个Excel表格没有正确的方法。 - Julien

0
我曾经遇到过类似的问题,这是我的解决方案。需要注意的是,它会失去 yusuzech 的答案的一些优点,因为它需要您指定感兴趣的范围。但另一方面,它可能更有效率、更适应不同的情况。
# specify the ranges you want to import from the excel sheet
v_ranges <- c("A3:F54",   "H3:M54",   "O3:T54",   "V3:AA54",  "AC3:AH54")

# specify the names of the dataframes
v_names <- c("21Q3", "21Q2", "21Q1", "20Q4", "20Q3")

# specify sheet and path
v_path_file <- "my_path/my_excel_file.xlsx"
v_sheet <- "my_sheet_name"

# define the import function, with v_ranges as your ranges of interest, v_path_file as the excel workbook you want to import from, and v_sheet the sheet name of the file
f_import_excel_by_range <- function(.x) {
  janitor::clean_names(
    readxl::read_excel(v_path_file,
             sheet = v_sheet,
             range = .x, 
             col_names = TRUE, na = c(" ", "NA"), trim_ws = TRUE, skip = 1)
  )
}

my_file_name <- 
  purrr::map(v_ranges, f_import_excel_by_range) %>%
  purrr::set_names(paste0("my_file_name_",v_names))

# extract databases to the environment
base::invisible(base::list2env(my_file_name, .GlobalEnv))

我相信通过在函数中包含路径、文件以及工作表名称,可以改进此功能。如果我找到了,我会进行编辑。欢迎反馈。


网页内容由stack overflow 提供, 点击上面的
可以查看英文原文,
原文链接