从颜色和填充图例中移除线条

23

我有一个包含三种不同图例的图表:一个用于linetype,一个用于color,以及一个用于fill。在colorfill的图例中,还有一些线条是我希望删除的,但是该如何实现呢?

以下是一些示例代码:

# some data
hline_df <- data.frame(name = c('a', 'b'), y = c(1, 2))
df <- data.frame(x = c(1, 2), y = c(0.5, 1.5), con = c('a', 'b'), col = c('d', 'e'))

# the plot
ggplot(df, aes(x, y, fill = con)) +
  geom_bar(stat = 'identity') + 
  geom_point(aes(color = col)) +
  geom_hline(data = hline_df, aes(yintercept = y, linetype = name),
             color = 'red', show_guide = TRUE)

在此输入图像描述

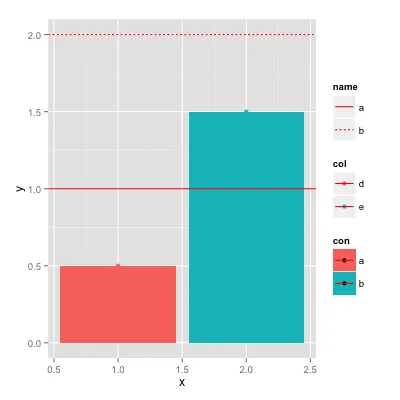
我已经明白了红线的“name”指南,这很好。
“col”指南有红线穿过点,我想把它们去掉!
“con”指南也有应该去除的红线。

我可以使用

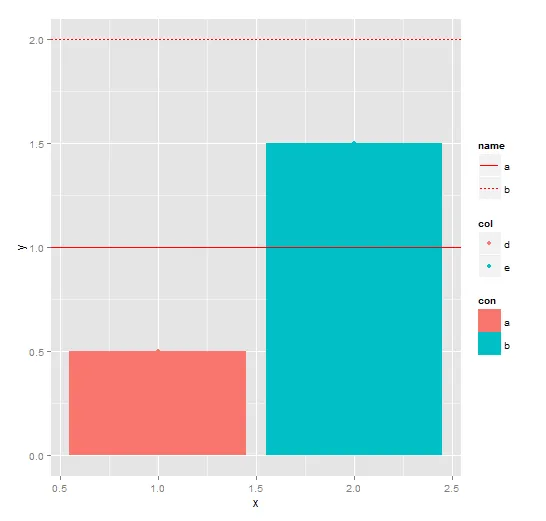
guides(fill = guide_legend(override.aes = list(colour = NULL)),
       color = guide_legend(override.aes = list(colour = NULL)))

这会去除颜色,但线条仍然存在。

提前表示感谢!


嗯,重新排列为
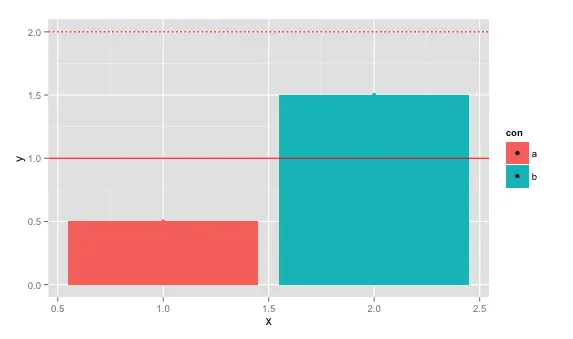
ggplot(df, aes(x,y,fill=con)) + geom_hline(data=hline_df,aes(yintercept=y,linetype=name), color='red',show_guide=TRUE) + geom_point(aes(color=col)) + geom_bar(stat='identity') + geom_hline(data=hline_df,aes(yintercept=y,linetype=name), color='red',show_guide=F)似乎对于con有效,但红线仍在col中。老实说,我不明白为什么它能工作 :-) - drmariod
1
啊,我试图将 linetype=NULL 设置为无效,但结果并不如预期。同时,在后台和前台绘制水平线的技巧非常棒!你想发表一个答案,这样我就可以标记它为已解决了吗? - drmariod
3个回答

32

您可以在override.aes中设置linetype = 0"blank"(不同的linetype请参见这里)来为fillcolor guide设置样式。

另外,请注意我将ggplot中的fill aes从“顶级”移动到了geom_bar中。

ggplot(df, aes(x, y)) +
  geom_bar(aes(fill = con), stat = 'identity') + 
  geom_point(aes(color = col)) +
  geom_hline(data = hline_df, aes(yintercept = y, linetype = name), color = 'red', show_guide = TRUE) +
  guides(fill = guide_legend(override.aes = list(linetype = 0)),
         color = guide_legend(override.aes = list(linetype = 0)))

在此输入图片描述


谢谢,这个甚至更干净,解释了问题...它只是将 AES 线型设置为 0,用于填充和颜色图例...太棒了! - drmariod
非常好的答案。我一直在尝试提取多个图例,然后尝试将它们组合成一个图形解决方案。但是,这是一个更好,更优雅的解决方案!+1 - Jaap

5

根据用户20650的建议

ggplot(df, aes(x,y)) + 
  geom_hline(data=hline_df,aes(yintercept=y,linetype=name), color='red',show_guide=TRUE) + 
  geom_point(aes(color=col), size=5) + 
  geom_bar(aes(fill=con), stat='identity') + 
  geom_hline(data=hline_df,aes(yintercept=y,linetype=name), color='red',show_guide=F) + 
  guides(color = guide_legend(override.aes = list(linetype = 0)))

因此,第一个geom_hline创建了图例,但线条在柱状图后面...
第二个调用将线条带到了柱状图前面,但没有打印图例(很好的想法)。
最后一个指南是使用0覆盖美学线型...这样可以从图例中删除线条...我尝试了NULL,但之前没有起作用...

再次感谢。

enter image description here


3

使用:

ggplot(df, aes(x,y,fill=con)) + geom_bar(stat='identity') + 
  geom_point(aes(color=col)) +
  geom_hline(data=hline_df,aes(yintercept=y,linetype=name),color='red',show_guide=FALSE) +
  guides(linetype=FALSE,color=FALSE)

这个图表展示了:

enter image description here

谢谢@Jaap,但我想要所有的指南...只想从“con”和“col”指南中删除红线... - drmariod
1
所以,基本上 ggplot(df, aes(x,y,fill=con)) + geom_bar(stat='identity') + geom_point(aes(color=col)) + geom_hline(data=hline_df,aes(yintercept=y,linetype=name),color='red',show_guide=FALSE) 是针对 concol 的预期结果,但我也需要红线的指南... - drmariod

网页内容由stack overflow 提供, 点击上面的
可以查看英文原文,
原文链接