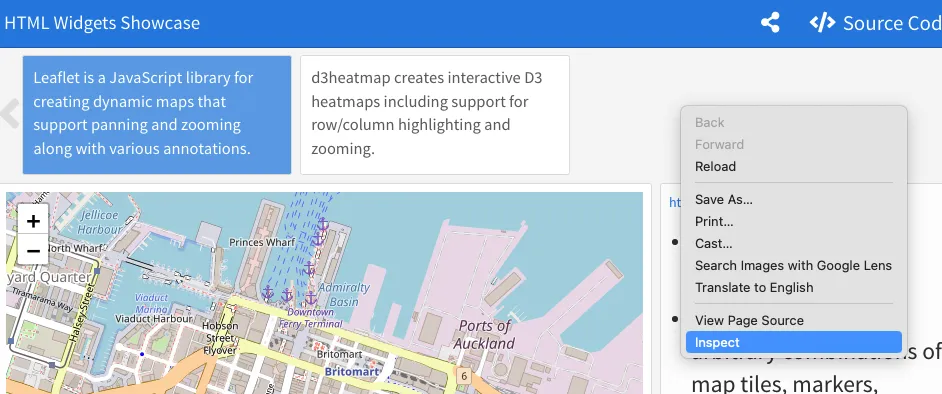
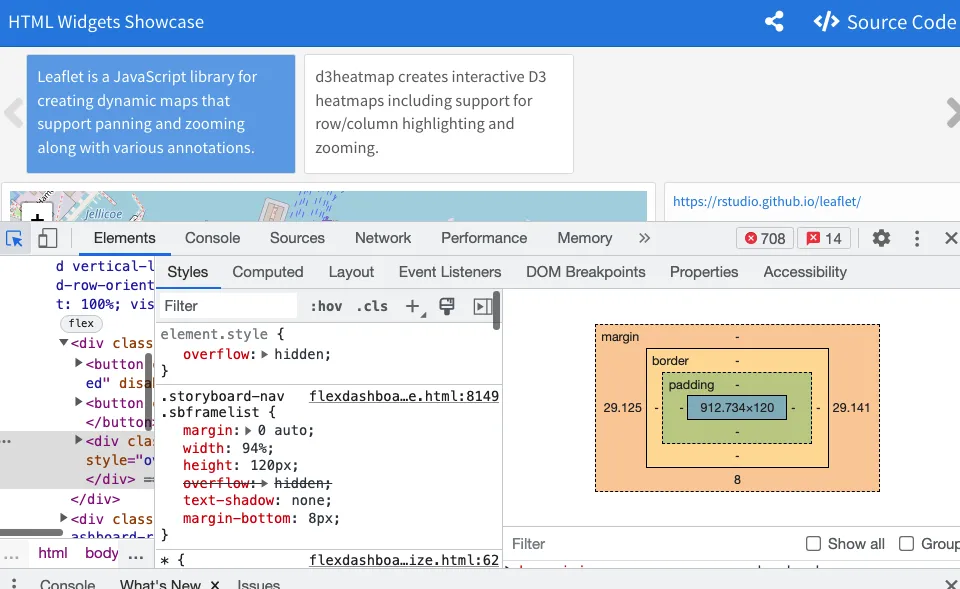
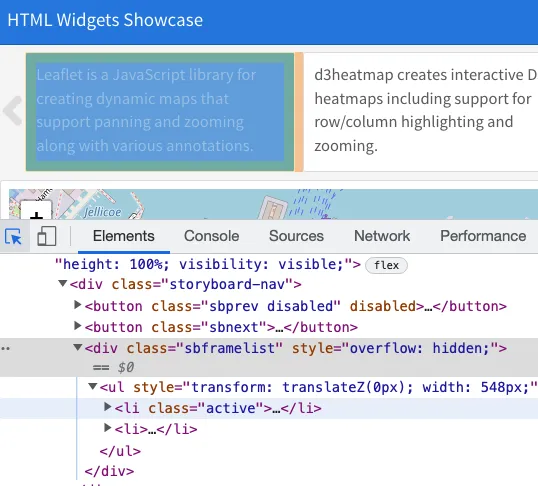
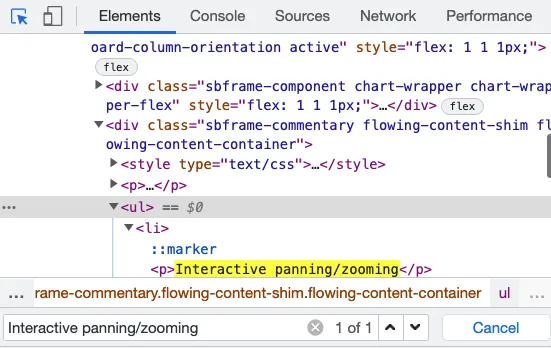
我找到了一个使用R中的Flexdashboard制作的仪表板示例:https://beta.rstudioconnect.com/jjallaire/htmlwidgets-showcase-storyboard/htmlwidgets-showcase-storyboard.html。此仪表板中有一些文本(即“子弹”),例如“使用地图瓦片、标记、多边形、线条、弹出窗口和GeoJSON任意组合来组成地图”。我想了解如何更改此类文本的字体/字体大小。
我在Stackoverflow上发现了这篇帖子(Change font size for individual text section in flexdashboard),该帖子介绍了如何更改标题的字体:
---
title: "Title"
output:
  flexdashboard::flex_dashboard:
theme: readable
orientation: columns
vertical_layout: fill
---

<style type="text/css">

.chart-title {  /* chart_title  */
   font-size: 30px;
   font-family: Algerian;

</style>
但我不确定这段代码是否可以用来更改每个页面上“项目符号文本”的字体/字号。
例如,如果您看一下此仪表板的前两个选项卡:
---
title: "HTML Widgets Showcase"
output:
flexdashboard::flex_dashboard:
storyboard: true
social: menu
source: embed
---
```{r setup, include=FALSE}
library(flexdashboard)
```
### Leaflet is a JavaScript library for creating dynamic maps that support panning and zooming along with various annotations.
```{r}
library(leaflet)
leaflet() %>%
addTiles() %>%
addMarkers(lng=174.768, lat=-36.852, popup="The birthplace of R")
```
***
https://rstudio.github.io/leaflet/
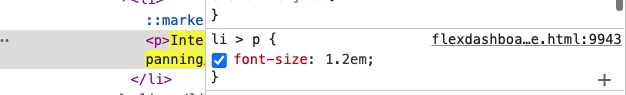
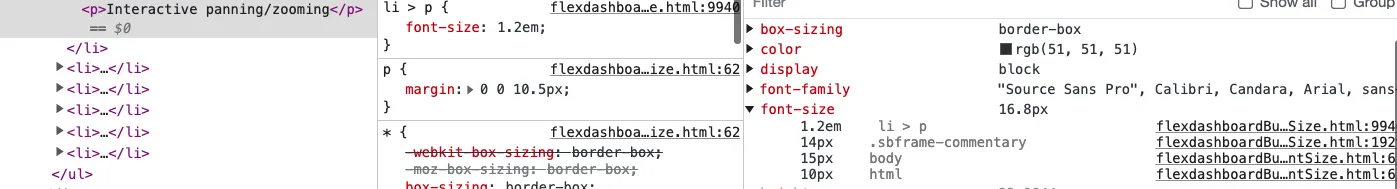
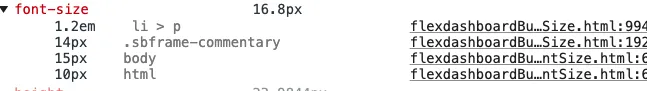
- Interactive panning/zooming
- Compose maps using arbitrary combinations of map tiles, markers, polygons, lines, popups, and GeoJSON.
- Create maps right from the R console or RStudio
- Embed maps in knitr/R Markdown documents and Shiny apps
- Easily render Spatial objects from the sp package, or data frames with latitude/longitude columns
- Use map bounds and mouse events to drive Shiny logic
### d3heatmap creates interactive D3 heatmaps including support for row/column highlighting and zooming.
```{r}
library(d3heatmap)
d3heatmap(mtcars, scale="column", colors="Blues")
```
***
https://github.com/rstudio/d3heatmap/
- Highlight rows/columns by clicking axis labels
- Click and drag over colormap to zoom in (click on colormap to zoom out)
- Optional clustering and dendrograms, courtesy of base::heatmap
我尝试添加字体/字号自定义功能,但好像没有任何变化:
---
title: "HTML Widgets Showcase"
output:
  flexdashboard::flex_dashboard:
    storyboard: true
    social: menu
    source: embed
---

```{r setup, include=FALSE}
library(flexdashboard)
```

### Leaflet is a JavaScript library for creating dynamic maps that support panning and zooming along with various annotations.

```{r}
library(leaflet)
leaflet() %>%
  addTiles() %>%
  addMarkers(lng=174.768, lat=-36.852, popup="The birthplace of R")
```

***


<style type="text/css">

.chart-title {  /* chart_title  */
   font-size: 30px;
   font-family: Algerian;

</style>

https://rstudio.github.io/leaflet/

- Interactive panning/zooming

- Compose maps using arbitrary combinations of map tiles, markers, polygons, lines, popups, and GeoJSON.

- Create maps right from the R console or RStudio

- Embed maps in knitr/R Markdown documents and Shiny apps

- Easily render Spatial objects from the sp package, or data frames with latitude/longitude columns

- Use map bounds and mouse events to drive Shiny logic


### d3heatmap creates interactive D3 heatmaps including support for row/column highlighting and zooming.

```{r}
library(d3heatmap)
d3heatmap(mtcars, scale="column", colors="Blues")
```

***


<style type="text/css">

.chart-title {  /* chart_title  */
   font-size: 30px;
   font-family: Algerian;

</style>

https://github.com/rstudio/d3heatmap/

- Highlight rows/columns by clicking axis labels

- Click and drag over colormap to zoom in (click on colormap to zoom out)

- Optional clustering and dendrograms, courtesy of base::heatmap
有人能展示一下如何做这个吗?
谢谢!