多重回答的分析

9
df1 <-
  data.frame(c("male", "female", "male"),
             c("1", "2", "3", "4", "5", "6"),
             seq(141, 170))

names(df1) = c("gender", "age", "height")

df1$age <- factor(
  df1$age,
  levels = c(1, 2, 3, 4, 5, 6),
  labels = c("16-24", "25-34", "35-44", "45-54", "55-64", "65+")
)

q1a = c(1, 0, 1, 0, 0, 1)
q1b = c(0, 0, 2, 2, 2, 0)
q1c = c(0, 0, 3, 3, 0, 3)
# 1,2 and 3 used to be compatible with existing datasets. 
# Could change all to 1 if necessary.

df2 <- data.frame(q1a = q1a, q1b = q1b, q1c = q1c)
df1 <- cbind(df1, df2)

rm(q1a, q1b, q1c, df2)

我希望您能在R中复制SPSS中的多重响应问题的分析。

目前,我正在使用以下代码:

#creating function for analysing questions with grouped data
multfreqtable <- function(a, b, c) {
  # number of respondents (for percent of cases)
  totrep = sum(a == 1 | b == 2 | c == 3)
  
  #creating frequency table
  table_a = data.frame("a", sum(a == 1))
  names(table_a) = c("question", "freq")
  table_b = data.frame("b", sum(b == 2))
  names(table_b) = c("question", "freq")
  table_c = data.frame("c", sum(c == 3))
  names(table_c) = c("question", "freq")
  table_question <- rbind(table_a, table_b, table_c)
  
  #remove individual question tables
  rm(table_a, table_b, table_c)
  
  #adding total
  total = as.data.frame("Total")
  totalsum = (sum(table_question$freq, na.rm = TRUE))
  totalrow = cbind(total, totalsum)
  names(totalrow) = c("question", "freq")
  table_question = rbind(table_question, totalrow)
  
  #adding percentage column to frequency table
  percentcalc = as.numeric(table_question$freq)
  percent = (percentcalc / totalsum) * 100
  table_question <- cbind(table_question, percent)
  
  #adding percent of cases column to frequency table
  poccalc = as.numeric(table_question$freq)
  percentofcases = (poccalc / totrep) * 100
  table_question <- cbind(table_question, percentofcases)
  
  #print percent of cases value
  total_respondents <<- data.frame(totrep)
  
  #remove all unnecessary data and values
  rm(
    total,
    totalsum,
    totalrow,
    b,
    c,
    percent,
    percentcalc,
    percentofcases,
    totrep,
    poccalc
  )
  
  return(table_question)
}

#calling function - must tie to data.frame using $ !!!
q1_frequency <- multfreqtable(df1$q1a, df1$q1b, df1$q1c)

#renaming percent of cases - This is very important while using current method
total_respondents_q1 <- total_respondents
rm(total_respondents)

将其作为结果生成此表:

输出表

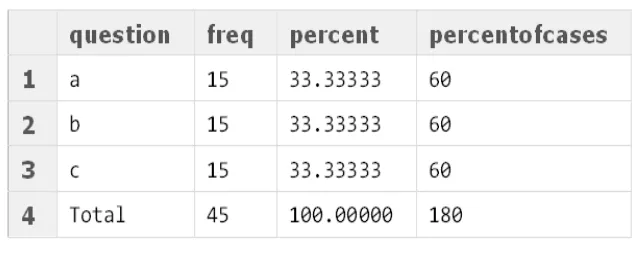
我正在寻找更有效的方法来完成这个任务,最好不需要编辑函数,即使有更多或更少的多项选择题也可以。


2
这似乎是你早期问题的重复。有什么变化吗?请发布您的预期结果,因为我不会再尝试解密您的代码,但一旦知道您想要什么,很可能可以指向现有函数。 - Andrie
@Andrie 这段代码与我之前的帖子相同,只是问题的重点发生了变化。上面的图像显示了我的代码输出表格。如果这不是展示我期望结果的最佳方式,那我很抱歉。 - BuckyOH
所以你想让这个函数更通用? - Roman Luštrik
@RomanLuštrik。是的,理想情况下我想指定一系列要分析的问题。如上所述,如果每个问题都使用1s更容易,那么也可以。 - BuckyOH
3个回答

12

对于你需要做的事情来说,你的函数实际上过于复杂了。我认为像这样的一个函数应该能够工作并且更加灵活。

multfreqtable = function(data, question.prefix) {
  # Find the columns with the questions
  a = grep(question.prefix, names(data))
  # Find the total number of responses
  b = sum(data[, a] != 0)
  # Find the totals for each question
  d = colSums(data[, a] != 0)
  # Find the number of respondents
  e = sum(rowSums(data[,a]) !=0)
  # d + b as a vector. This is your overfall frequency 
  f = as.numeric(c(d, b))
  data.frame(question = c(names(d), "Total"),
             freq = f,
             percent = (f/b)*100,
             percentofcases = (f/e)*100 )
}

在你的示例数据集中添加另一个问题:

set.seed(1); df1$q2a = sample(c(0, 1), 30, replace=T)
set.seed(2); df1$q2b = sample(c(0, 2), 30, replace=T)
set.seed(3); df1$q2c = sample(c(0, 3), 30, replace=T)

制作一个“q1”响应的表格:
> multfreqtable(df1, "q1")
  question freq   percent percentofcases
1      q1a   15  33.33333             60
2      q1b   15  33.33333             60
3      q1c   15  33.33333             60
4    Total   45 100.00000            180

制作“q2”回答的表格:
> multfreqtable(df1, "q2")
  question freq   percent percentofcases
1      q2a   14  31.11111       53.84615
2      q2b   13  28.88889       50.00000
3      q2c   18  40.00000       69.23077
4    Total   45 100.00000      173.07692

多个问题的表格

这是一个修改后的函数版本,可以让您一次创建多个问题的表格列表:

multfreqtable = function(data, question.prefix) {
  z = length(question.prefix)
  temp = vector("list", z)

  for (i in 1:z) {
    a = grep(question.prefix[i], names(data))
    b = sum(data[, a] != 0)
    d = colSums(data[, a] != 0)
    e = sum(rowSums(data[,a]) !=0)
    f = as.numeric(c(d, b))
    temp[[i]] = data.frame(question = c(sub(question.prefix[i], 
                                            "", names(d)), "Total"),
                           freq = f,
                           percent = (f/b)*100,
                           percentofcases = (f/e)*100 )
    names(temp)[i] = question.prefix[i]
  }
  temp
}

示例:

> multfreqtable(df1, "q1")
$q1
  question freq   percent percentofcases
1        a   15  33.33333             60
2        b   15  33.33333             60
3        c   15  33.33333             60
4    Total   45 100.00000            180

> test1 = multfreqtable(df1, c("q1", "q2"))
> test1
$q1
  question freq   percent percentofcases
1        a   15  33.33333             60
2        b   15  33.33333             60
3        c   15  33.33333             60
4    Total   45 100.00000            180

$q2
  question freq   percent percentofcases
1        a   14  31.11111       53.84615
2        b   13  28.88889       50.00000
3        c   18  40.00000       69.23077
4    Total   45 100.00000      173.07692

> test1$q1
  question freq   percent percentofcases
1        a   15  33.33333             60
2        b   15  33.33333             60
3        c   15  33.33333             60
4    Total   45 100.00000            180

你好,这似乎正是我想要的。从同一命令中获得多个输出选项也是非常方便的功能。 - BuckyOH
好的,谢谢。我已经尝试过了,没有收到任何响应,并且所有答案都编码为1,这是我遇到问题的两个主要方面之一,到目前为止还没有发现任何问题。 - BuckyOH
我一直在尝试使用加权数据集来适应这段代码,但是一直没有成功。在我的原始代码中,我使用了xtabs而不是table来实现这一点。colSums似乎会计算每列中的情况,而不考虑它们的值。是否可能在这里应用加权? - BuckyOH
谢谢。自从上次以来,我还没有时间再次查看这个问题,我会考虑是更新还是添加一个新的问题更好。 - BuckyOH
这真的很酷 - 但如果列是字符/因子变量,它就无法工作了,是吗? - NewBee
即使存在缺失值,它也能正常工作 :( - NewBee

1

这是一个老问题。然而,你可以使用userfriendlyscience包非常容易地分析多个响应的调查数据。

library(userfriendlyscience)
multiResponse (data, c('v1', 'v2', 'v3'))

1
实际上,userfriendlyscience 中的那个函数是受到被接受的答案启发而来的。请检查 ?multiResponse - BroVic
1
还有expss R包。 - CK7

0

我注意到这篇文章已经相当老了,但是我找不到更现代的解决方案。这是基于dplyr/tidyverse方法的我的版本。

mult_resp = function(df1, mv_q = c("q1a", "q1b", "q1c")){

  df2 = df1 %>%
    mutate(id = rownames(.)) %>%  #row id for counting n_cases
    select(id, everything()) %>% 
    mutate_at(mv_q, ~ ifelse(. != 0, 1, 0)) %>%
    gather(question, resp,-id, -gender,-age,-height) 

  #count number of cases excluding "all zeros" cases
  n_cases = df2 %>% group_by(id) %>%
    summarise(n = sum(resp)) %>% 
    summarise(sum(n > 0))

  #output table
  res = df2 %>% 
    group_by(question) %>%
    summarise(freq = sum(resp)) %>%
    mutate(
      percent = freq/sum(freq) *100,
      percent_of_cases = freq/as.numeric(n_cases)*100
      ) %>% 
    rbind(., 
          data.frame(question ="Total", 
                     freq =sum(.$freq, na.rm=TRUE),
                     percent =sum(.$percent, na.rm=TRUE),
                     percent_of_cases = sum(.$percent_of_cases, na.rm=TRUE)
                     )
          )
    res
}

例子:

> mult_resp(df1, mv_q = c("q1a", "q1b", "q1c"))
# A tibble: 4 x 4
  question  freq percent percent_of_cases
  <chr>    <dbl>   <dbl>            <dbl>
1 q1a         15    33.3               60
2 q1b         15    33.3               60
3 q1c         15    33.3               60
4 Total       45   100.               180

网页内容由stack overflow 提供, 点击上面的
可以查看英文原文,
原文链接