我有以下的 Rmarkdown 试验:
---
title: "Test kableExtra"
date: "3/20/2021"
output: pdf_document
classoption: landscape
---
```{r setup, include=FALSE}
knitr::opts_chunk$set(echo = TRUE)
library(tidyverse)
library(kableExtra)
```
# R Markdown
```{r echo=FALSE}
library(knitr)
library(xtable)
dt <- mtcars[1:5, 1:6]
t1 <- kbl(dt, booktabs = T)
t2 <- kbl(dt, booktabs = T)
t3 <- ggplot(dt,aes(x=mpg,y=cyl)) +
geom_point()
png(file="plot1.png",width=200,height=200)
print(t3)
dev.off() # close the png file
```
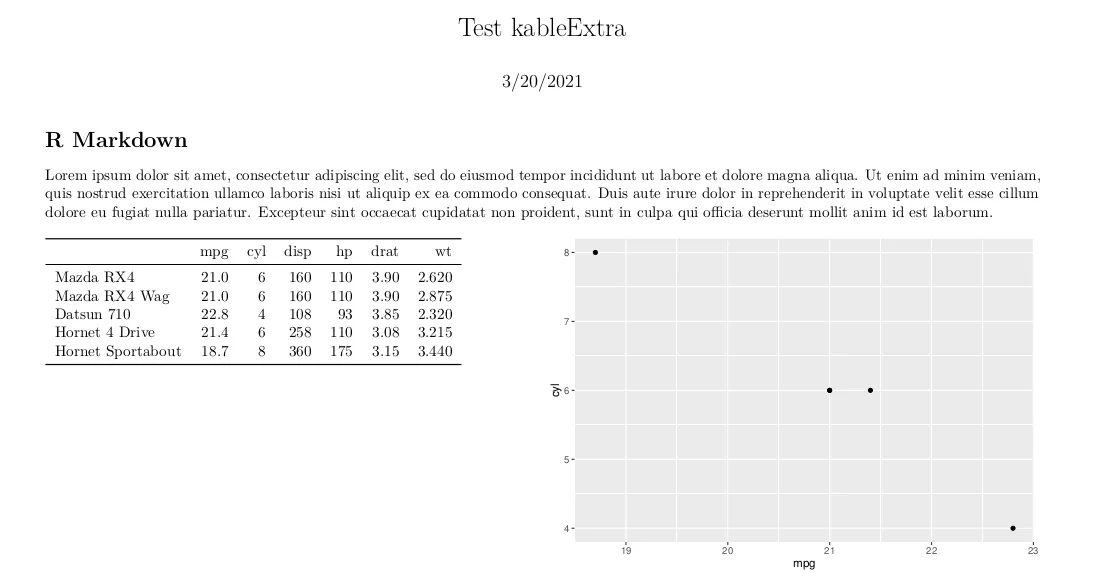
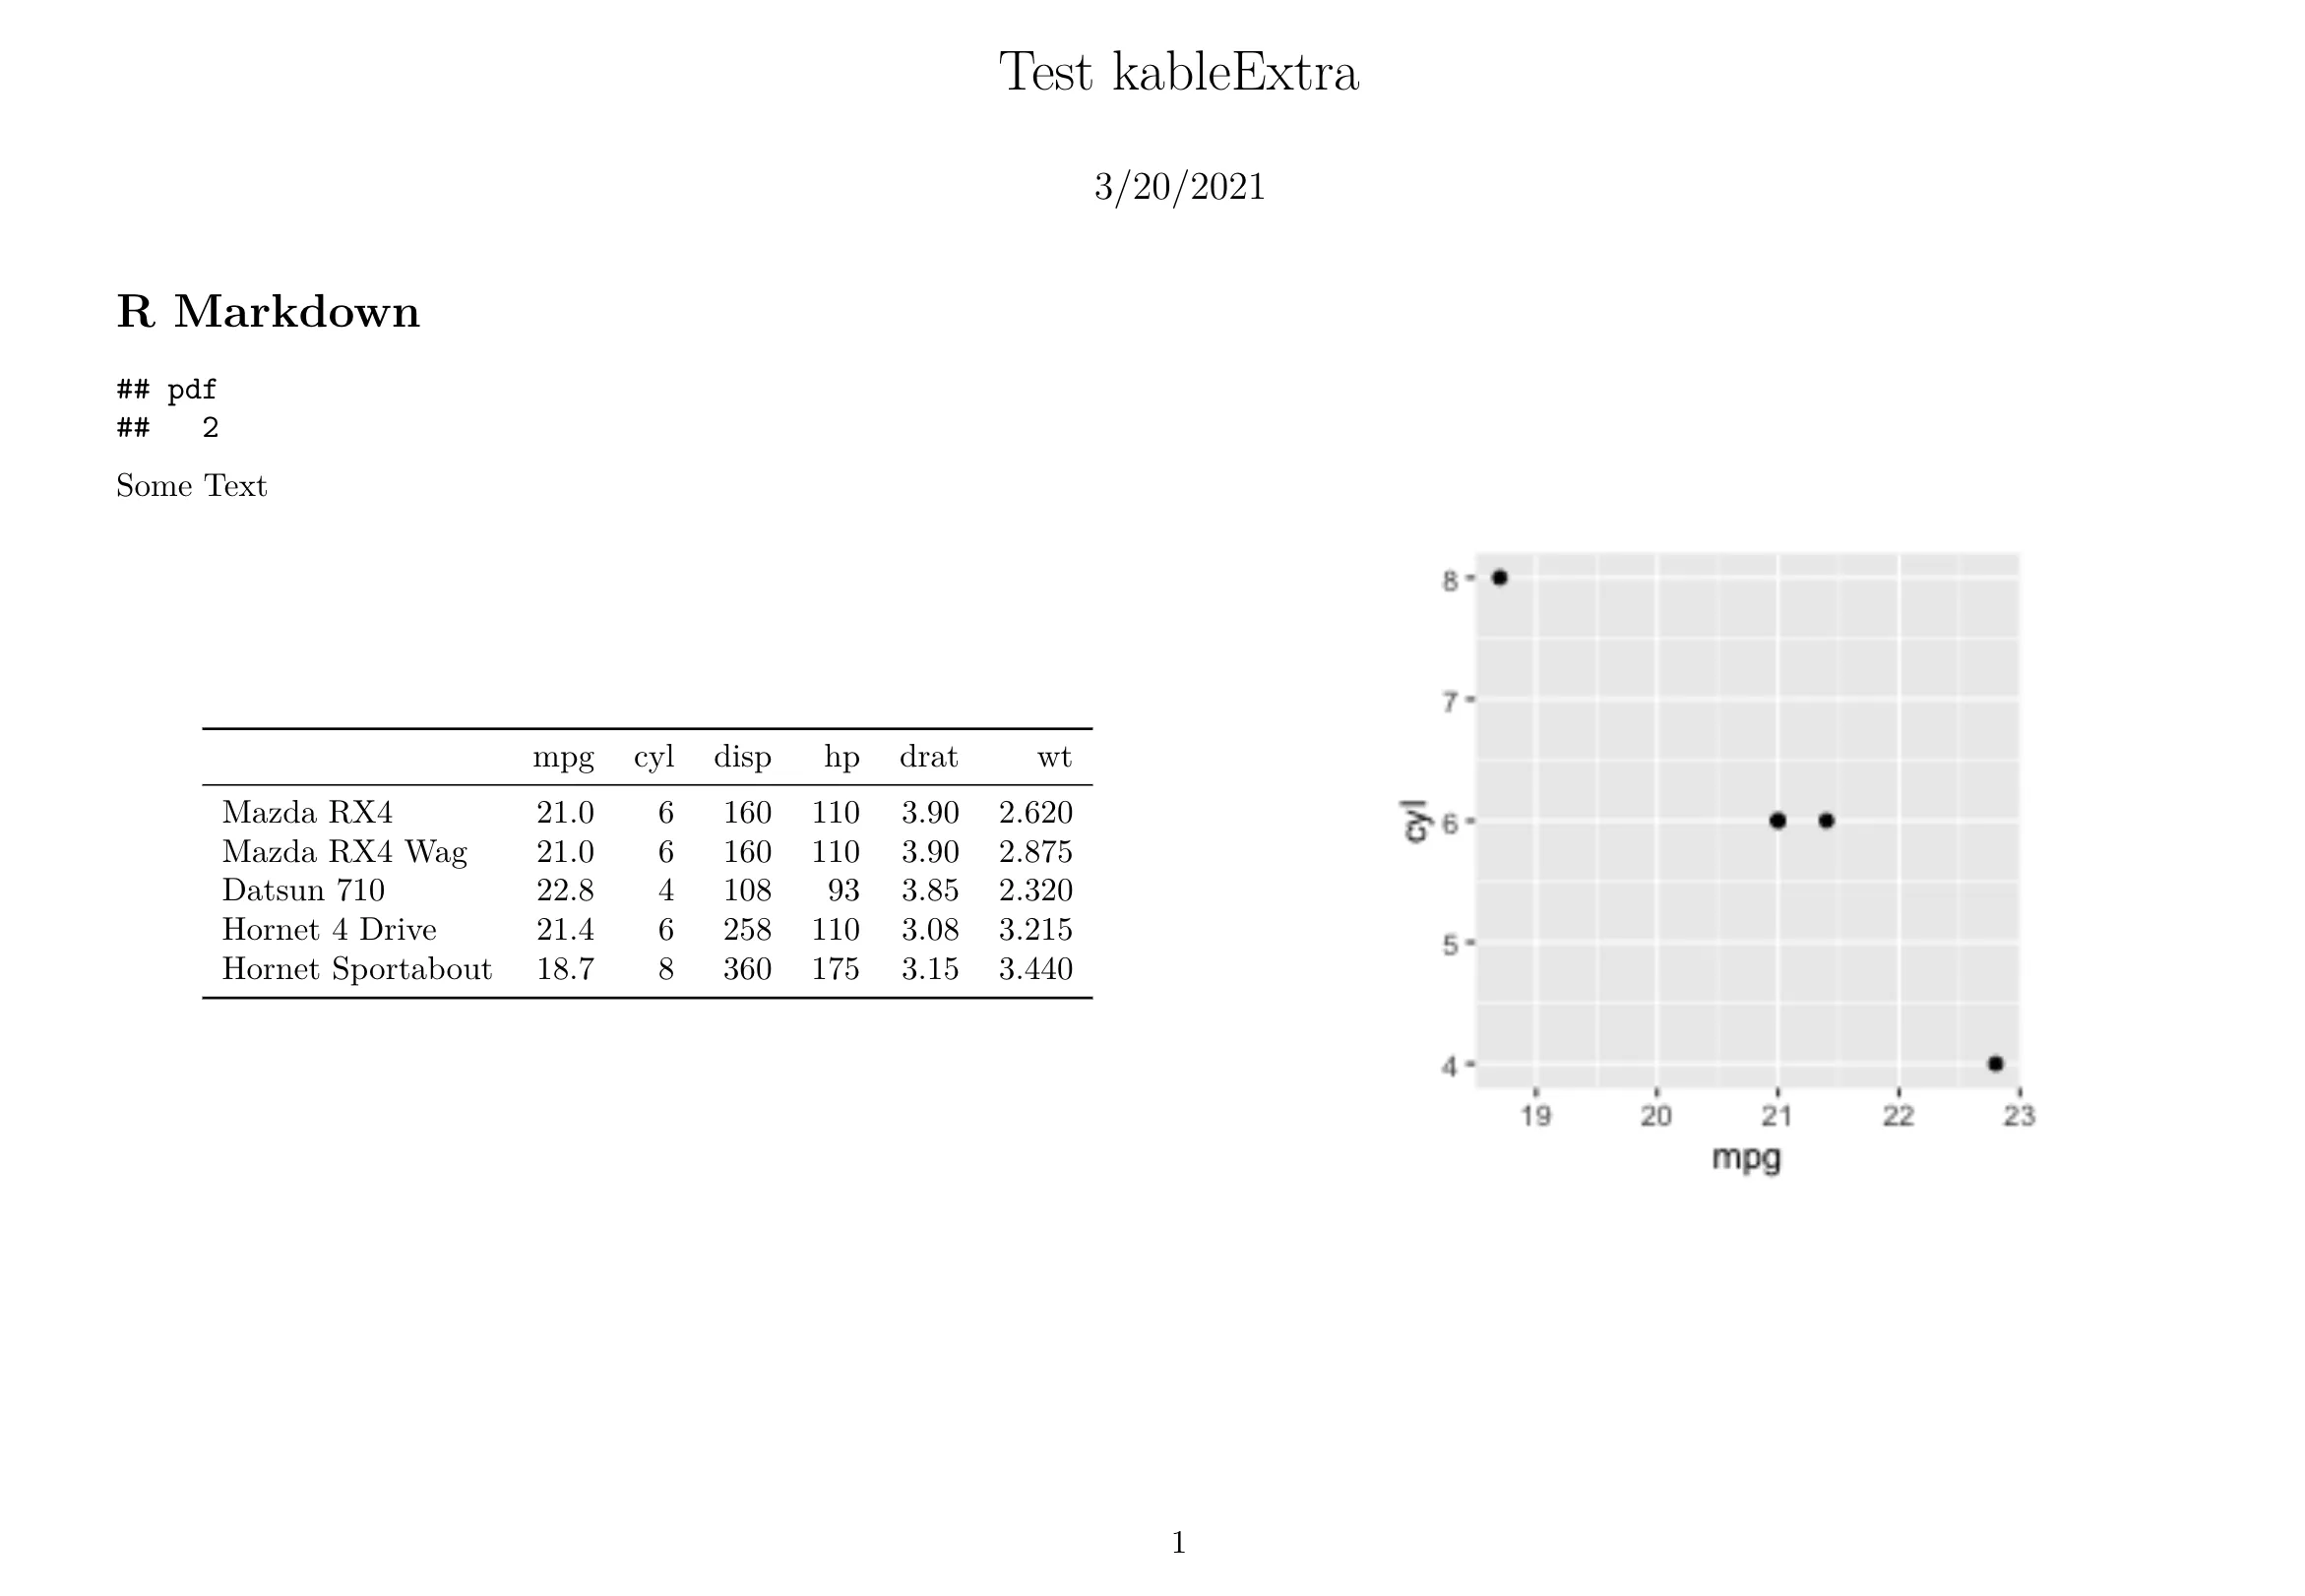
Some Text
\begin{table}[!h]
\begin{minipage}{.5\linewidth}
\centering
```{r echo=FALSE}
t1
```
\end{minipage}%
\begin{minipage}{.5\linewidth}
\centering
\includegraphics[width=\textwidth]{plot1.png}
\end{minipage}
\end{table}
当您编织它时,它可以正常工作,但我希望图形和表格在顶部对齐。 有什么好主意吗?
如果您有更好的想法将ggplot放在kbl表旁边,欢迎交流!
谢谢, 迈克尔