我正在使用 ggpubr 软件包中的 ggarrange() 将 4 个不同的绘图整合到一个单独的绘图中。以下是一个示例:
library(ggpubr)
library(ggplot2)
p1 <- ggplot(iris, aes(x = Sepal.Length, y = Sepal.Width)) + geom_point() + ggtitle("Plot 1")
p2 <- ggplot(iris, aes(x = Petal.Length, y = Petal.Width)) + geom_point() + ggtitle("Plot 2")
p3 <- ggplot(iris, aes(x = Sepal.Length, y = Petal.Width)) + geom_point() + ggtitle("Plot 3")
p4 <- ggplot(iris, aes(x = Petal.Length, y = Sepal.Width)) + geom_point() + ggtitle("Plot 4") +
facet_wrap(~Species)
plot.list <- list(p1, p2, p3, p4)
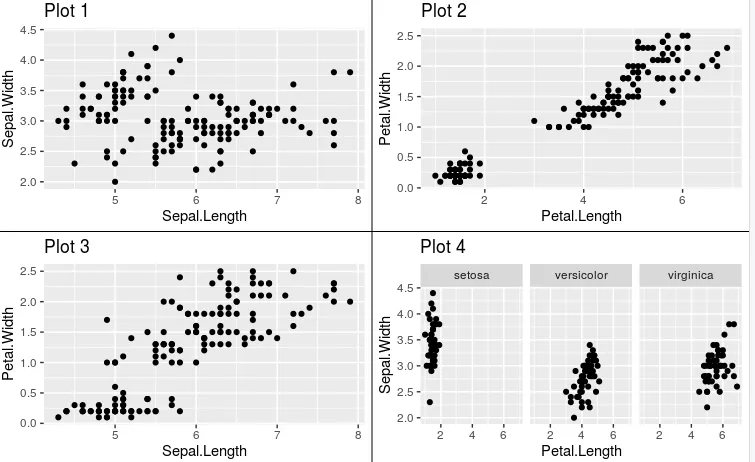
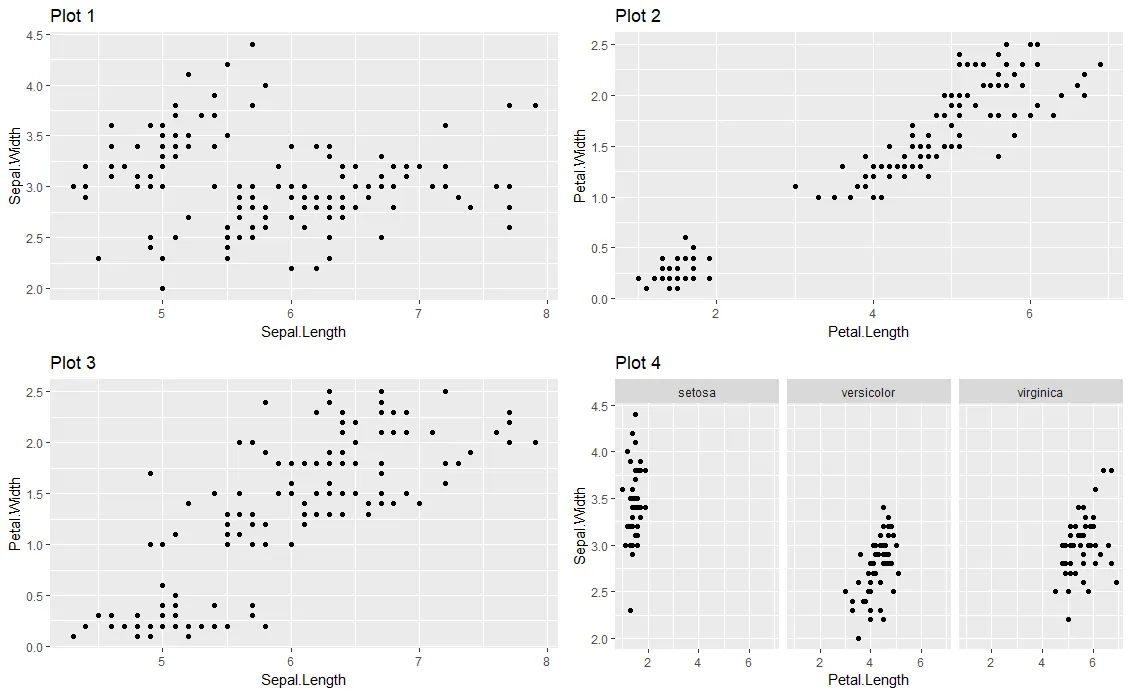
ggarrange(plotlist = plot.list)
输出:
输出:
我想在每个绘图区域周围画一个边框,像这样:
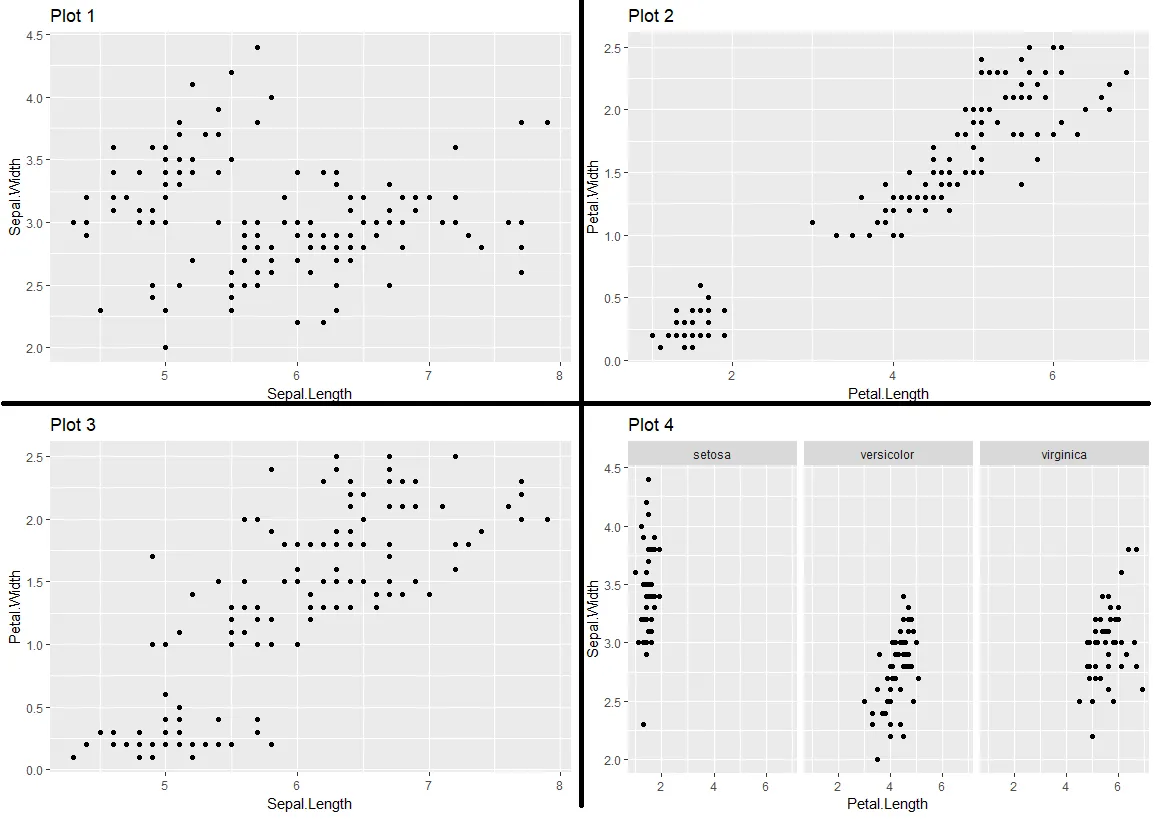
有没有办法画出这个边框?谢谢!