我试图将MATLAB的刻度线与我的网格对齐,但我找不到一个好的方法来偏移标签。
另外,如果我运行
另外,如果我运行
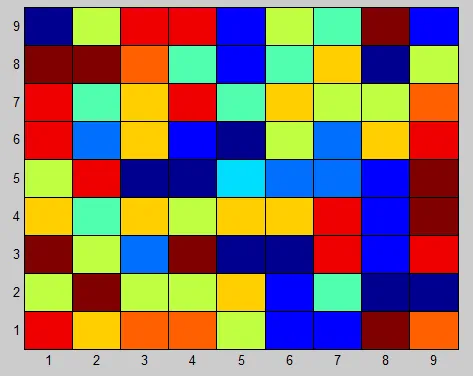
set(gca,'XTickLabel',1:10),我的x轴刻度标签最终会从1到5。发生了什么事?set(gca,'XTickLabel',1:10),我的x轴刻度标签最终会从1到5。发生了什么事?f = figure(1)
X = randi(10,10,10);
surf(X)
view(0,90)
ax = gca;
XTick = get(ax, 'XTick')
XTickLabel = get(ax, 'XTickLabel')
set(ax,'XTick',XTick+0.5)
set(ax,'XTickLabel',XTickLabel)
YTick = get(ax, 'YTick')
YTickLabel = get(ax, 'YTickLabel')
set(ax,'YTick',YTick+0.5)
set(ax,'YTickLabel',YTickLabel)
或者,如果您已经了解所有内容,请从头开始手动操作:
[N,M] = size(X)

set(ax,'XTick',0.5+1:N)
set(ax,'XTickLabel',1:N)
set(ax,'YTick',0.5+1:M)
set(ax,'YTickLabel',1:M)
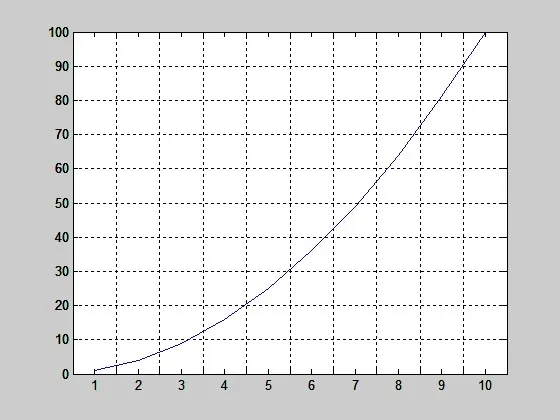
xlabels=1:1:10;                               %define where we want to see the labels
xgrid=0.5:1:10.5;                             %define where we want to see the grid

plot(xlabels,xlabels.^2);                     %plot a parabola as an example
set(gca,'xlim',[min(xgrid) max(xgrid)]);      %set axis limits so we can see all the grid lines
set(gca,'XTickLabel',xlabels);                %print the labels on this axis

axis2=copyobj(gca,gcf);                       %make an identical copy of the current axis and add it to the current figure
set(axis2,'Color','none');                    %make the new axis transparent so we can see the plot
set(axis2,'xtick',xgrid,'XTickLabel','');     %set the tick marks to the grid, turning off labels
grid(axis2,'on');                             %turn on the grid
这个脚本显示以下图形: