你可以使用下面的代码作为起点。它并不完美,但这是一个让你进一步改进它的机会。
src = cv2.imread("demo.jpg")
gray = cv2.cvtColor(src, cv2.COLOR_BGR2GRAY)
img_thresh = cv2.threshold(gray, 150, 255, cv2.THRESH_BINARY)[1]
contours,hierarchy = cv2.findContours(img_thresh,cv2.RETR_TREE,cv2.CHAIN_APPROX_SIMPLE)
mask = np.zeros(src.shape, dtype="uint8")
for c in contours:
x, y, w, h = cv2.boundingRect(c)
if w>80 and w<100:
cv2.rectangle(mask, (x, y), (x+w-13, y+h), (255, 255, 255), -1)
elif w>100:
cv2.rectangle(mask, (x+10, y+10), (x+w, y+h), (255, 255, 255), -1)
thresh = cv2.threshold(cv2.cvtColor(mask, cv2.COLOR_BGR2GRAY), 150, 255, cv2.THRESH_BINARY_INV)[1]
thresh = np.float32(thresh)
dst = cv2.cornerHarris(thresh, 5, 3, 0.04)
ret, dst = cv2.threshold(dst, 0.1*dst.max(), 255, 0)
dst = np.uint8(dst)
ret, labels, stats, centroids = cv2.connectedComponentsWithStats(dst)
criteria = (cv2.TERM_CRITERIA_EPS + cv2.TERM_CRITERIA_MAX_ITER, 100, 0.001)
corners = cv2.cornerSubPix(thresh, np.float32(centroids), (5,5), (-1,-1), criteria)
corners = np.int32(corners)
dict1 = dict()
dict2 = dict()
for i in range(len(corners)):
dict1.setdefault(corners[i][0], []).append(corners[i][1])
dict2.setdefault(corners[i][1], []).append(corners[i][0])
empty = np.zeros(src.shape, dtype="uint8")
for key, value in dict1.items():
if len(value)==2:
cv2.line(empty, (key, value[0]), (key, value[1]), (255,255,255), 2)
for key, value in dict2.items():
if len(value)==2:
cv2.line(empty, (value[0], key), (value[1], key), (255,255,255), 2)
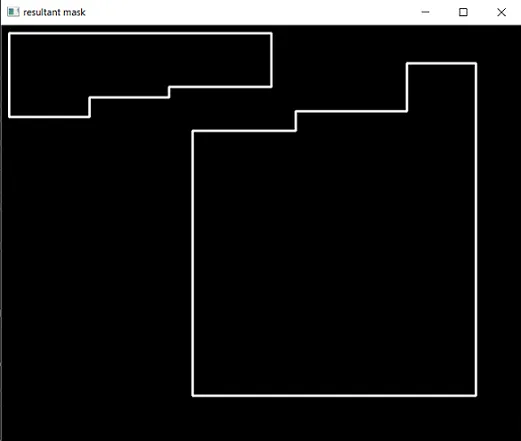
cv2.imshow("resultant mask",empty)
cv2.waitKey(0)
输出:
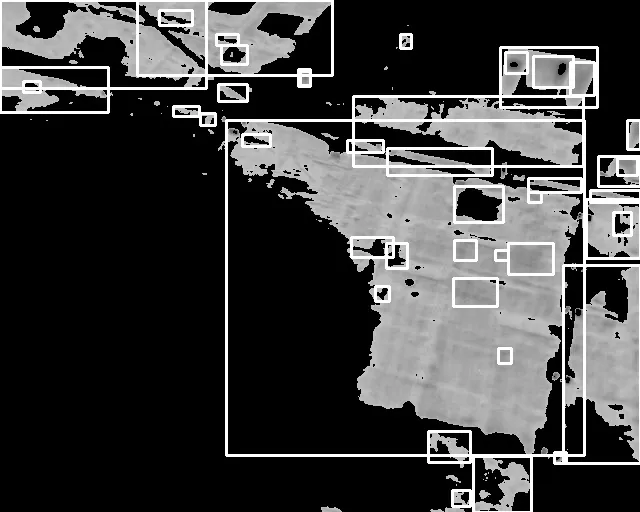
图1:中间层蒙版
注:保留HTML标签不翻译。
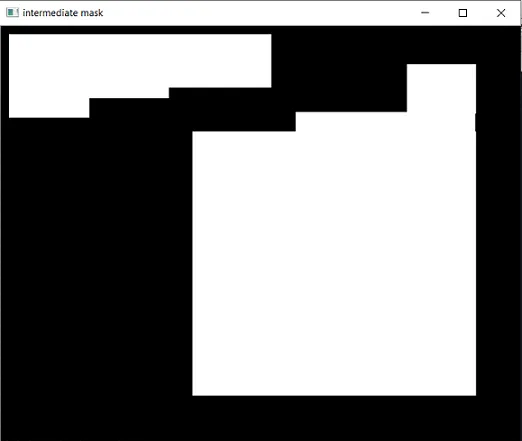
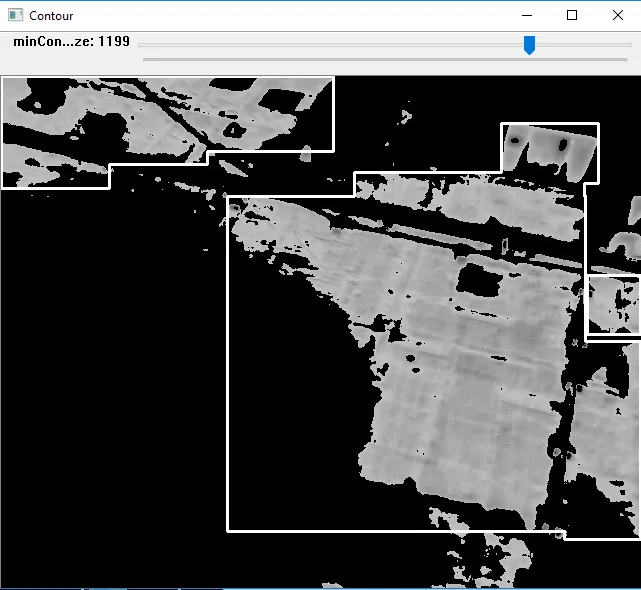
图2: 使用Harris角点检测算法检测到的角点
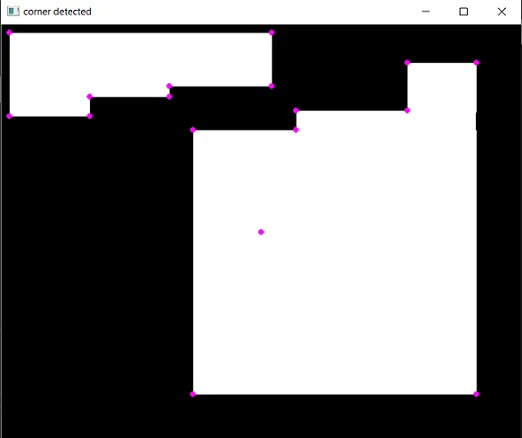
图3: 最终结果