不再使用旗帜,我们现在可以使用以编程方式插入的路标,这些路标可以在Instruments的“兴趣点”工具中捕获。
在iOS 15和macOS 12中,我们可以使用OSSignposter。例如,在Swift中:
导入统一的日志框架:
```
import os.signpost
```
为感兴趣的点创建一个`OSSignposter`:
```
private let pointsOfInterest = OSSignposter(subsystem: Bundle.main.bundleIdentifier!, category: .pointsOfInterest)
```
当您想要开始一个感兴趣的范围时,您可以“开始”一个时间间隔:
```
let id = pointsOfInterest.makeSignpostID()
let state = pointsOfInterest.beginInterval("Download", id: id, "\(index)")
```
当您想要结束一个感兴趣的范围时,您可以“结束”它:
```
pointsOfInterest.endInterval(#function, state)
```
如果您对时间范围不感兴趣,而只对单个标记感兴趣,您可以直接发出一个事件:
```
pointsOfInterest.emitEvent("Done")
```
如果您需要支持旧的操作系统版本,在iOS 13和macOS 10.15中,我们可以使用
os_signpost,如WWC 2019的
入门指南所示。
例如,在Swift中:
导入统一的日志框架:
```
import os.signpost
```
为感兴趣的点创建一个`OSLog`:
```
private let pointsOfInterest = OSLog(subsystem: Bundle.main.bundleIdentifier!, category: .pointsOfInterest)
```
当您想要开始一个感兴趣的范围时,您可以使用`.begin`开始一个感兴趣的点:
```
let id = OSSignpostID(log: pointsOfInterest)
os_signpost(.begin, log: pointsOfInterest, name: "Download", signpostID: id, "Download %d", index)
```
当您想要结束一个感兴趣的范围时,您可以使用`.end`结束它:
```
os_signpost(.end, log: pointsOfInterest, name: "Download", signpostID: id, "Download %d", index)
```
如果您对时间范围不感兴趣,而只对单个标志感兴趣,您可以直接发布一个`.event`:
```
os_signpost(.event, log: pointsOfInterest, name: "Done", "All done")
```
或者在Objective-C中:
导入统一的日志标记框架:
```
@import os.signpost;
```
为感兴趣的点创建一个`OSLog`:
```
os_log_t log = os_log_create("ViewController", OS_LOG_CATEGORY_POINTS_OF_INTEREST);
```
当您想要开始一个感兴趣的范围时,您可以使用`.begin`开始一个感兴趣的点:
```
os_signpost_id_t identifier = os_signpost_id_generate(log);
os_signpost_interval_begin(log, identifier, "Download", "Started %d", index);
```
当您想要结束一个感兴趣的范围时,您可以使用`.end`结束它:
```
os_signpost_interval_end(log, identifier, "Download", "Finished %d", index);
```
如果您对时间范围不感兴趣,而只对单个标记感兴趣,您可以直接发布一个`.event`:
```
os_signpost_event_emit(log, OS_SIGNPOST_ID_EXCLUSIVE, "Done");
```
无论如何,“Points of Interest”工具现在可以在Instruments中以图形方式表示一系列的下载和解析操作(每个队列限制为每个队列两个并发操作)。
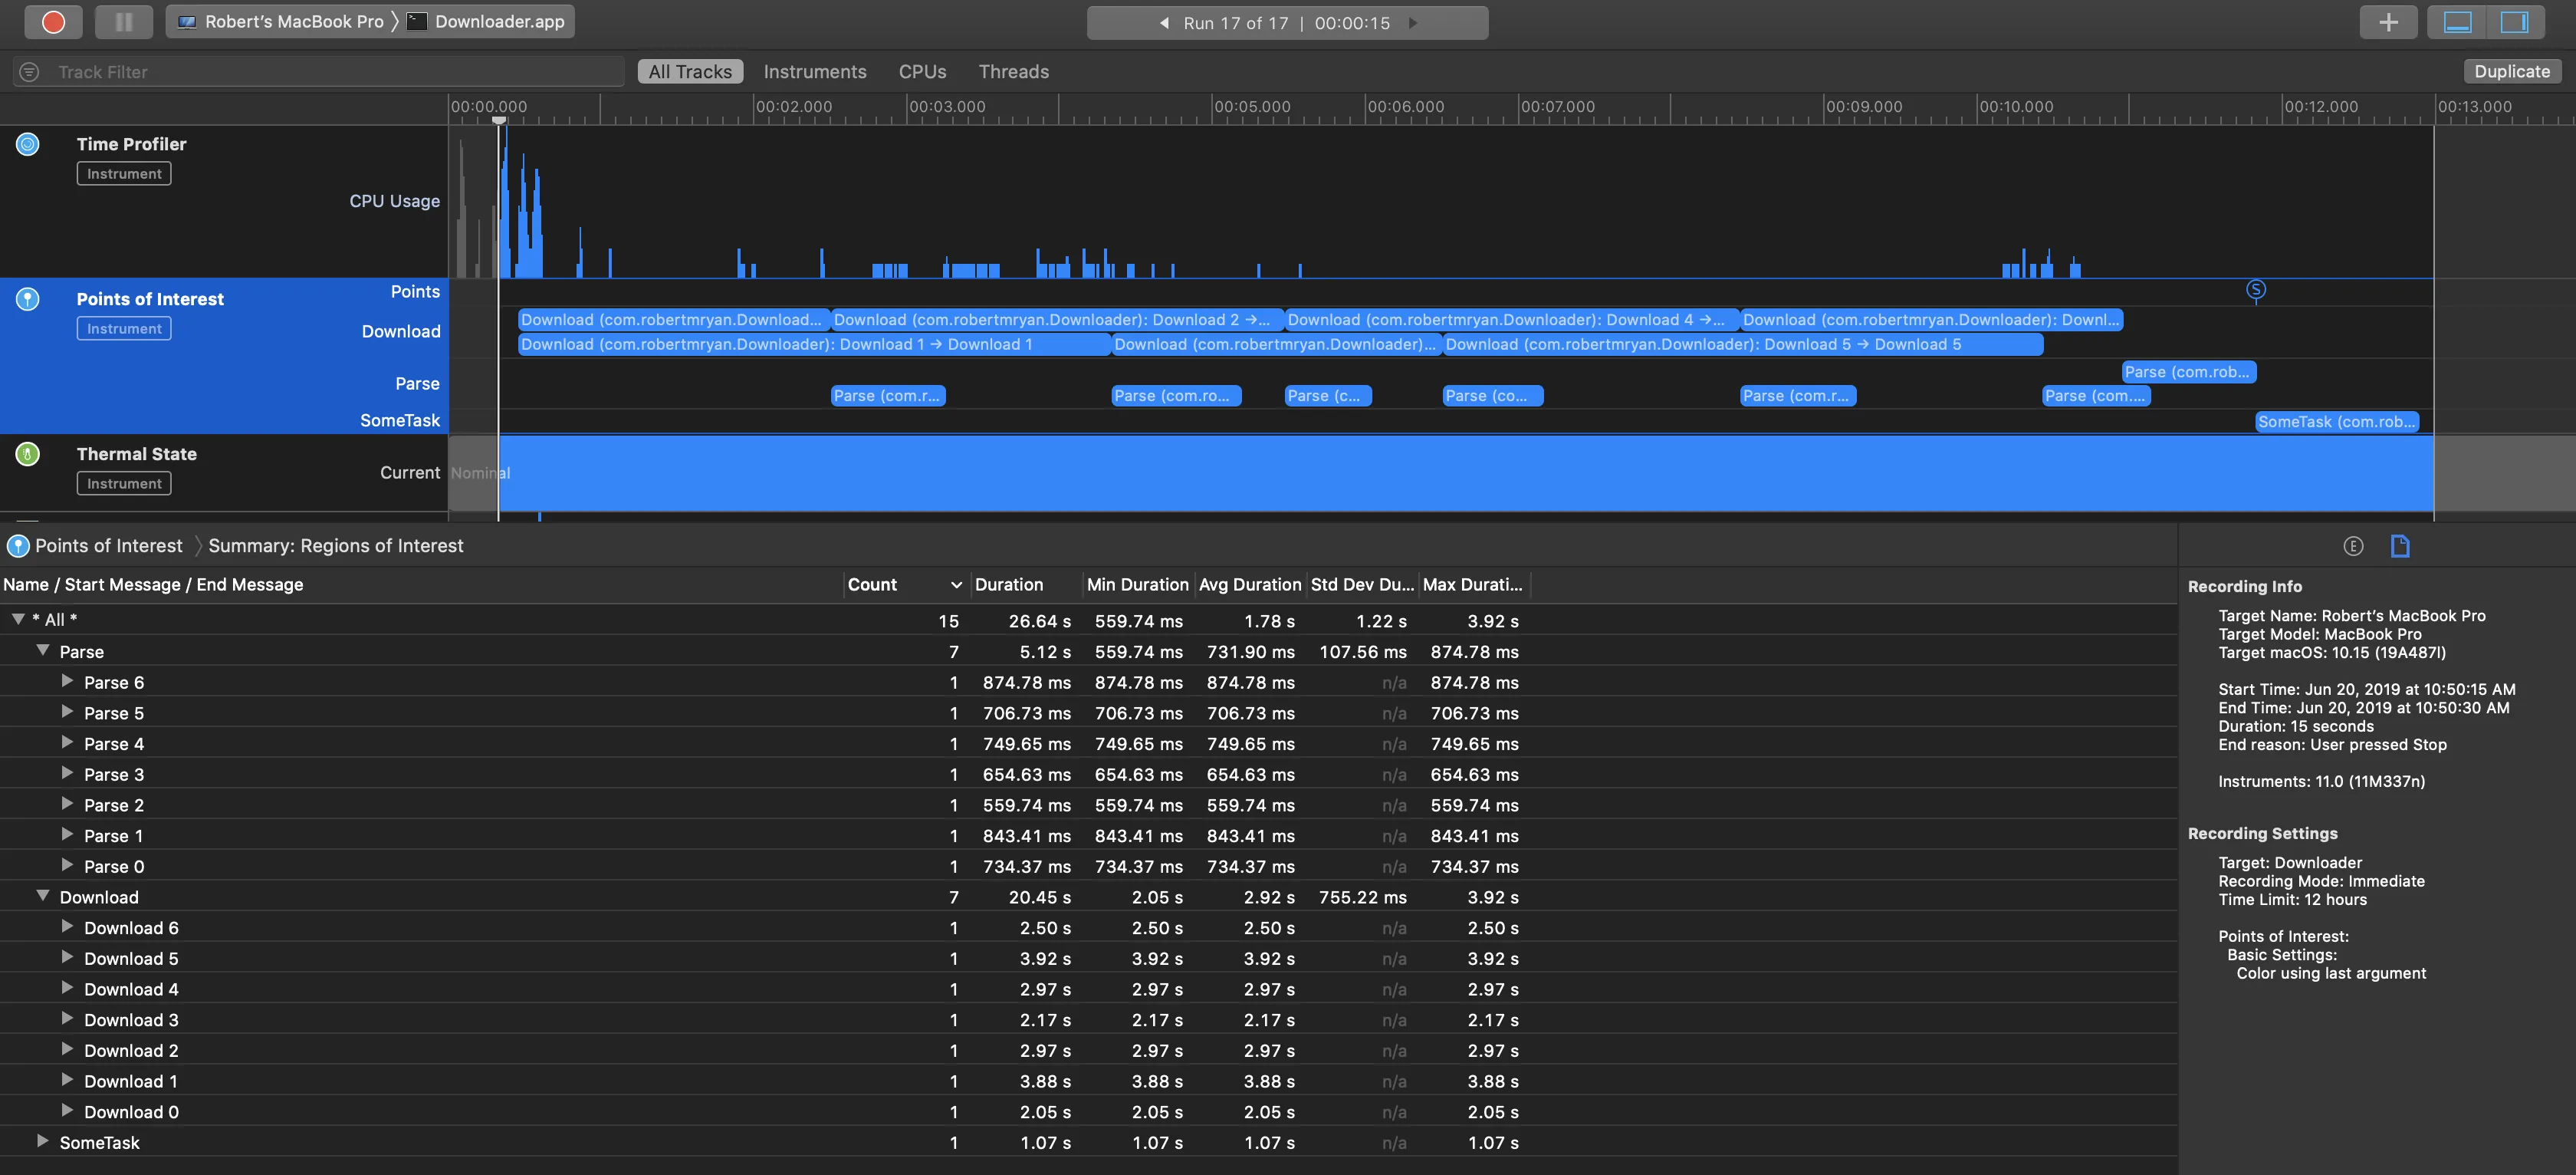
请注意,在“Points of Interest”工具中,
name值(一个集合中我使用了
Download作为名称,另一个集合中我使用了
Parse作为名称)被很好地分隔到不同的泳道中。而且,由于我使用了可选的格式字符串,我实际上可以看到消息,可以清楚地将每个下载和解析操作与我的应用程序中的特定任务相关联。
上面我使用了可选的
OSSignpostID参数,因为我有多个重叠的范围,并且我想避免将特定的
.end与相应的
.begin混淆。如果您不使用兴趣点范围,或者您没有重叠的范围,从技术上讲,如果不存在任何可能的歧义,您实际上不需要使用此可选参数。(即使您使用这些标志点标识符,请确保相关的
.begin和
.end标志点的
name也匹配,否则Instruments将无法将它们识别为同一兴趣点范围的起始和结束,即使具有相同的标志点ID。)
无论如何,现在您已经在“Points of Interest”工具中填充了信息,您可以双击范围来选择它,或者三击范围来设置您的检查范围。
在iOS 10和macOS 10.12中,我们使用了"kdebug_signpost"。这在WWDC 2016视频《系统跟踪深入解析》中有所说明(不幸的是,该视频已不再可用)。
对于那些需要离散时间的进程,我们可以使用"kdebug_signpost_start"和"kdebug_signpost_end"。例如:
kdebug_signpost_start(SignPostCode.download.rawValue, UInt(index), 0, 0, SignPostColor.orange.rawValue)
performDownload {
    kdebug_signpost_end(SignPostCode.download.rawValue, UInt(index), 0, 0, SignPostColor.orange.rawValue)
}
要标记时间中的一个瞬间,我们可以使用
kdebug_signpost。
kdebug_signpost(SignPostCode.done.rawValue, 0, 0, 0, SignPostColor.red.rawValue)
第一个参数只是一个唯一的数字代码,对应于我们在Instruments中将使用的“标志代码名称”。您可以使用任何您想要的值(介于0和16383之间),但我使用的是指定任务类型的某些值。
enum SignPostCode: UInt32 {
case download = 0
case parse = 1
case done = 2
}
其余的参数可以是任何你想要的UInt值,但在我的示例中,我将使用第二个参数作为唯一标识符来匹配重复的start和end调用,我将使用最后一个参数来为Instruments中的区域设置颜色编码。
enum SignPostColor: UInt {
case blue = 0
case green = 1
case purple = 2
case orange = 3
case red = 4
}
完成这个步骤后,您可以在Instruments中对应用程序进行分析,在Instruments工具栏的右侧点击“+”按钮,然后添加“兴趣点”。通过将“标志代码名称”配置为与我传递给标志的第一个参数相匹配的数字值,Instruments实际上会为我翻译这些代码。一旦我对应用程序进行了分析,我现在可以清楚地看到我的兴趣点已经被突出显示了。
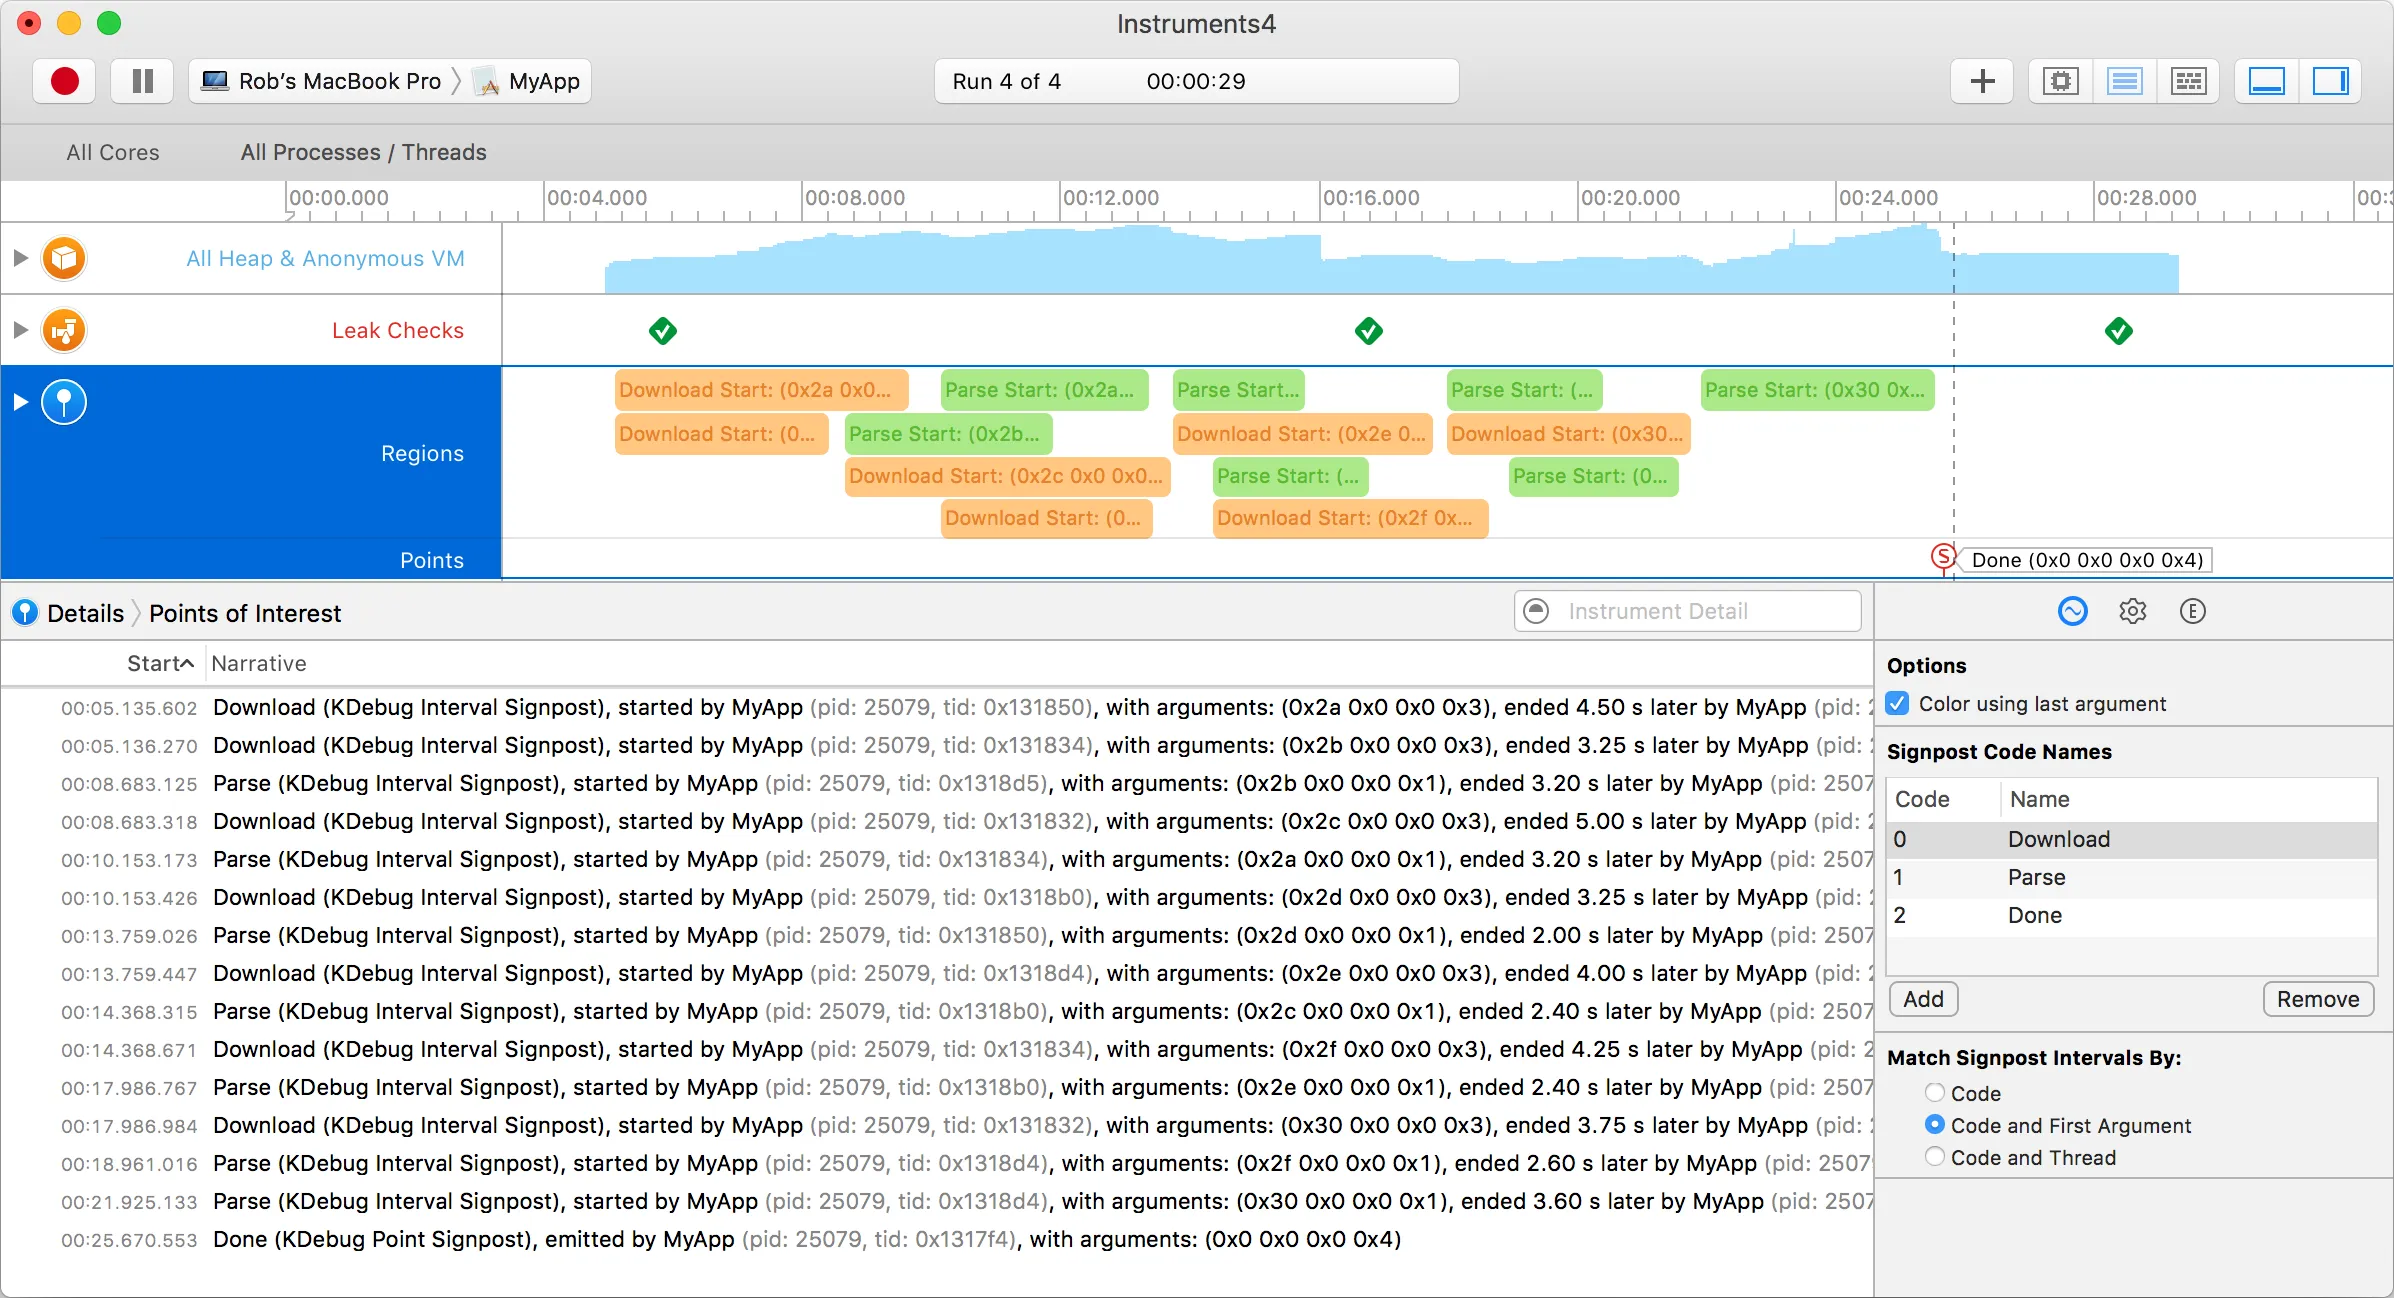
在这个快照中,我对七个下载操作(橙色)和七个解析操作(绿色)进行了分析,分别限制为每次两个。当它们完成时,我发布了一个单独的“完成”标志(红色图钉)。但是这个演示应用程序的细节并不重要,而是展示了Instruments的“兴趣点”如何呈现单个标志和起始/结束标志。
主要问题是我现在清楚地知道了代码中的事件与Instruments中所见的事件之间的对应关系。如果我想要,我可以在标志范围列表中
控制-点击一个条目,并告诉Instruments“设置时间过滤器”,这样当我返回到其他仪器(分配或时间分析器等)时,检查范围将被过滤为我应用程序中相关的兴趣点。
注意,上述是Swift。在Objective-C中,
kdebug_signpost API类似,但你必须包含以下内容:
#import <sys/kdebug_signpost.h>
显然,你对代码中的枚举定义的方式也会发生变化。
请注意,这个`kdebug_signpost` API是在iOS 10/macOS 10.12中引入的。头文件告诉我们早期的操作系统版本可以使用`syscall`。
In previous versions of the operating system, applications could use:
syscall(SYS_kdebug_trace, APPSDBG_CODE(DBG_MACH_CHUD, <your event code>) | DBG_FUNC_<type>, arg1, arg2, arg3, arg4);
to record events that would be displayed by Instruments. syscall(2) is now deprecated and this interface replaces the above call.
注意:如果你发现自己在早期的操作系统版本上不得不使用
syscall,你将需要导入
<sys/kdebug.h>。
#import <sys/kdebug.h>
此外,我在任何头文件中都找不到关于
SYS_kdebug_trace的声明,但在网上偶然发现了一个参考,称该值为
180,我进行了实证验证。
#ifndef SYS_kdebug_trace
#define SYS_kdebug_trace 180
#endif