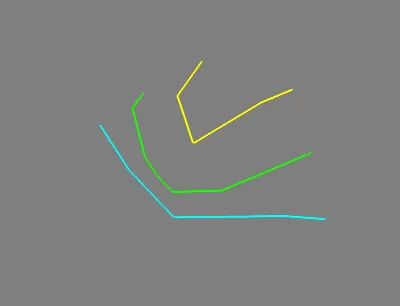
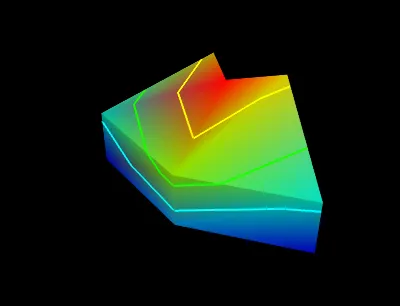
我有一组数据存储在VTK文件中,它代表了一个具有标量点数据数组的域的切片。我正在尝试生成所述标量的轮廓图,使其看起来类似于使用ParaView制作的附加图片。我宁愿坚持使用vtk库而不使用其他东西(如Matplotlib),因为我认为它们通常产生更好的可视化效果。 我已经查看了几个在线示例,但它们都对我无效(没有抛出错误,我最终只得到一个仅有背景的空渲染),我所能做的就是数据的表面图(例如:here)。
这是我目前的代码版本(与成功生成表面图的代码非常相似):
这是我目前的代码版本(与成功生成表面图的代码非常相似):
# import data
reader = vtk.vtkDataSetReader()
reader.SetFileName('inputDataFiles/k_zCut.vtk')
reader.ReadAllVectorsOn()
reader.ReadAllScalarsOn()
reader.Update()

# access data
data = reader.GetOutput()
d = data.GetPointData()
array=d.GetArray('k')

# create the filter
contours = vtk.vtkContourFilter()
contours.SetInput(reader.GetOutput())
contours.GenerateValues(5,1.,5.)

# create the mapper
mapper = vtk.vtkPolyDataMapper()
mapper.SetInput(contours.GetOutput())
mapper.ScalarVisibilityOff()
mapper.SetScalarRange(1., 5.)

# create the actor
actor = vtk.vtkActor()
actor.SetMapper(mapper)

# create a rendering window and renderer
ren = vtk.vtkRenderer()
ren.SetBackground( 0.329412, 0.34902, 0.427451 ) #Paraview blue

# Assign actor to the renderer
ren.AddActor(actor)

renWin = vtk.vtkRenderWindow()
renWin.AddRenderer(ren)
renWin.SetSize(750, 750)

# create a renderwindowinteractor
iren = vtk.vtkRenderWindowInteractor()
iren.SetRenderWindow(renWin)

# render
renWin.Render()

# screenshot
w2if = vtk.vtkWindowToImageFilter()
w2if.SetInput(renWin)
w2if.Update()
w2if.SetMagnification(5.)

writer = vtk.vtkPNGWriter()
writer.SetFileName("screenshot.png")
writer.SetInput(w2if.GetOutput())
writer.Write()

# Enable user interface interactor
iren.Initialize()
iren.Start()
以下是我输入文件的缩短部分。非常感谢您的帮助。
# vtk DataFile Version 2.0
sampleSurface
ASCII
DATASET POLYDATA
POINTS 34813 float
0 0 0
0 -0.000191589 0
0.000264399 0.000157061 0
0 0.000313389 0
0.000264347 -0.000191923 0
0 -0.000383178 0
-0.000395709 0 0
-0.000395709 0.000156695 0
3.60174e-05 0.000486922 0
0.000528387 0 0

POLYGONS 69284 277136
3 4105 4371 3861
3 4102 3861 4371
3 4656 4371 4373
3 4105 4373 4371
3 3624 3861 3390
3 3621 3390 3861
3 4105 3863 3861
3 3624 3861 3863
3 3188 3390 2990
3 3187 2990 3390
3 3624 3390 3391
3 3188 3391 3390

POINT_DATA 34813
FIELD attributes 1
k 1 34813 float
0.849464 0.391519 1.52947 1.05206 0.391519 0.253736 1.39481 1.39481 0.636517 1.21019
0.640193 0.114295 1.12557 0.644143 0.629569 0.114295 0.485032 0.477396 1.39961 0.0860201
1.66665 1.24058 1.45939 0.483719 1.01318 0.163198 0.317574 0.792821 0.317125 0.658835
POINTS 34813 float应该是POINTS 10 float,因为只列出了 10 个点。) 此外,POLYGONS部分是指向点的索引列表,因此所有列出的数字都无效,因为它们大于 10。再次强调,原始文件可能完全正常,只是您在问题中提供的示例并不完全有效。 - Joe Kington