我曾经试图寻找答案来让这个工作,但一直没有成功,我快要疯了,所以我有一个问题。最近我下载了JFreeChart来创建一些图表并将它们实现在我的GUI中。下面是我想插入图表的面板(用白色标出)和GUI的截图:reports1 http://www.freeimagehosting.net/newuploads/eff3r.pngreports2 http://www.freeimagehosting.net/newuploads/v5sty.png。我使用NetBeans编辑器构建了GUI,并使用了一个在线可用的JFreeChart示例。下面是我的GUI代码:
这是结果:
import java.awt.Color;
import java.awt.event.WindowAdapter;
import java.awt.event.WindowEvent;
import java.math.BigDecimal;
import javax.swing.BorderFactory;
import javax.swing.JFrame;
import javax.swing.SwingConstants;
import javax.swing.table.DefaultTableCellRenderer;
import javax.swing.table.DefaultTableModel;
import org.jfree.chart.ChartFactory;
import org.jfree.chart.ChartPanel;
import org.jfree.chart.JFreeChart;
import org.jfree.chart.plot.PiePlot3D;
import org.jfree.data.general.DefaultPieDataset;
import org.jfree.data.general.PieDataset;
import org.jfree.util.Rotation;
public class Report extends JFrame implements Defaults {
public MMap j1map,j2map,j3map;
public int total_stations = 0, total_jobs = 0, total_parts = 0;
BigDecimal[] j1_systimebig, j1_worktimebig, j1_idletimebig, j1_queuetimebig,
j2_systimebig, j2_worktimebig, j2_idletimebig, j2_queuetimebig,
j3_systimebig, j3_worktimebig, j3_idletimebig, j3_queuetimebig;
public String sim_time;
BigDecimal systime = new BigDecimal(0);
BigDecimal worktime = new BigDecimal(0);
BigDecimal idletime = new BigDecimal(0);
BigDecimal queuetime = new BigDecimal(0);
/**
* Creates new form Report
*/
public Report() {
//setDefaultCloseOperation(JFrame.EXIT_ON_CLOSE);
setTitle(TITLE_Report);
validate();
setResizable(false);
setVisible(true);
//setLocationRelativeTo(null);
initComponents();
this.addWindowListener(new WindowAdapter() {
@Override
public void windowClosing(WindowEvent e) {
e.getWindow().dispose();
}
}
);
centertables();
//JLayeredPane layeredPane = new JLayeredPane();
PieChart demo = new PieChart("Which operating system are you using?");
demo.setOpaque(true);
demo.setBounds(0, 0, 300, 300);
demo.setFocusable(true);
demo.setBackground(Color.gray);
demo.setBorder(BorderFactory.createLineBorder(Color.black, 1));
//start();
demo.setDoubleBuffered(true);
//demo.pack();
//demo.setVisible(true);
//PieChart("teste");
chartPanel1.add(demo, new Integer(0));
//layeredPane.add(demo, new Integer(0));
//this.getContentPane().add(jLayeredPane1);
}
/* *************************************
* GRAPHICS
*************************************/
public void PieChart(String chartTitle) {
System.out.println("PieChart");
// This will create the dataset
PieDataset dataset = createDataset();
// based on the dataset we create the chart
JFreeChart chart = createChart(dataset, chartTitle);
// we put the chart into a panel
ChartPanel chartPanel = new ChartPanel(chart);
// default size
chartPanel.setPreferredSize(new java.awt.Dimension(250, 270));
// add it to our application
//setContentPane(chartPanel);
//StationsPanelGraph.add(chartPanel);
//jLayeredPane1.add(chartPanel, new Integer(0), 0);
}
private PieDataset createDataset() {
System.out.println("PieDataset");
DefaultPieDataset result = new DefaultPieDataset();
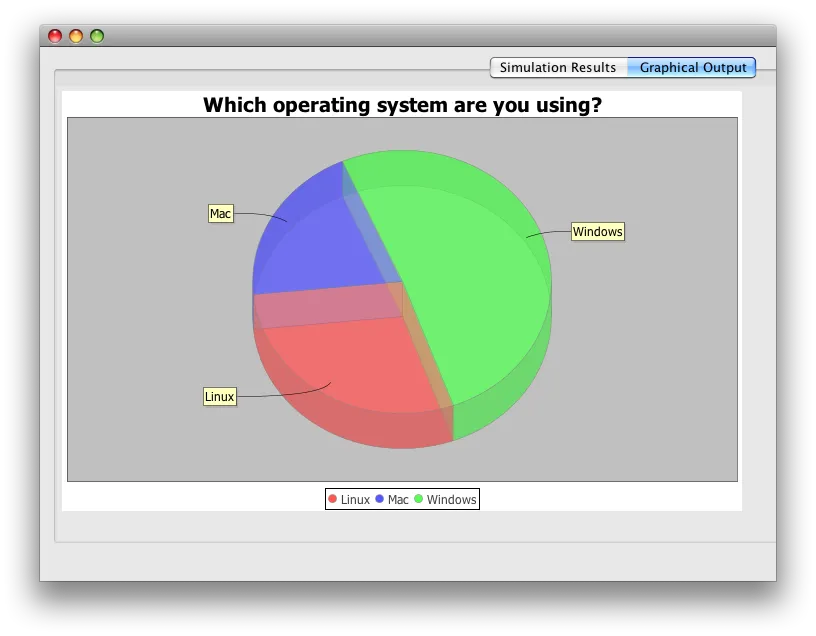
result.setValue("Linux", 29);
result.setValue("Mac", 20);
result.setValue("Windows", 51);
return result;
}
private JFreeChart createChart(PieDataset dataset, String title) {
System.out.println("Create Chart");
JFreeChart chart = ChartFactory.createPieChart3D(title, // chart title
dataset, // data
true, // include legend
true,
false);
PiePlot3D plot = (PiePlot3D) chart.getPlot();
plot.setStartAngle(290);
plot.setDirection(Rotation.CLOCKWISE);
plot.setForegroundAlpha(0.5f);
return chart;
}
/* *************************************
* END GRAPHICS
*************************************/
}
这是结果:
这是结果:
reports3 http://www.freeimagehosting.net/newuploads/unolz.png
我正在主类构造函数中初始化并添加图表,下面是图表的代码。由于代码超出了字符限制,我不得不避免发布整个代码,但是这里有一个完整代码的url(使用NetBeans进行Swing组件初始化):http://tny.cz/8a4e8b2f
有什么解决方案的提示吗?
提前感谢,如果需要其他任何信息,请告诉我。
org.jfree.chart.ChartPanel是一个JPanel。它有一个org.jfree.chart.JFreeChart,在paintComponent()中呈现。另请参见此示例。 - trashgod