ggplot2如何将抖动位置限制在地图边界内,比如美国州?

9
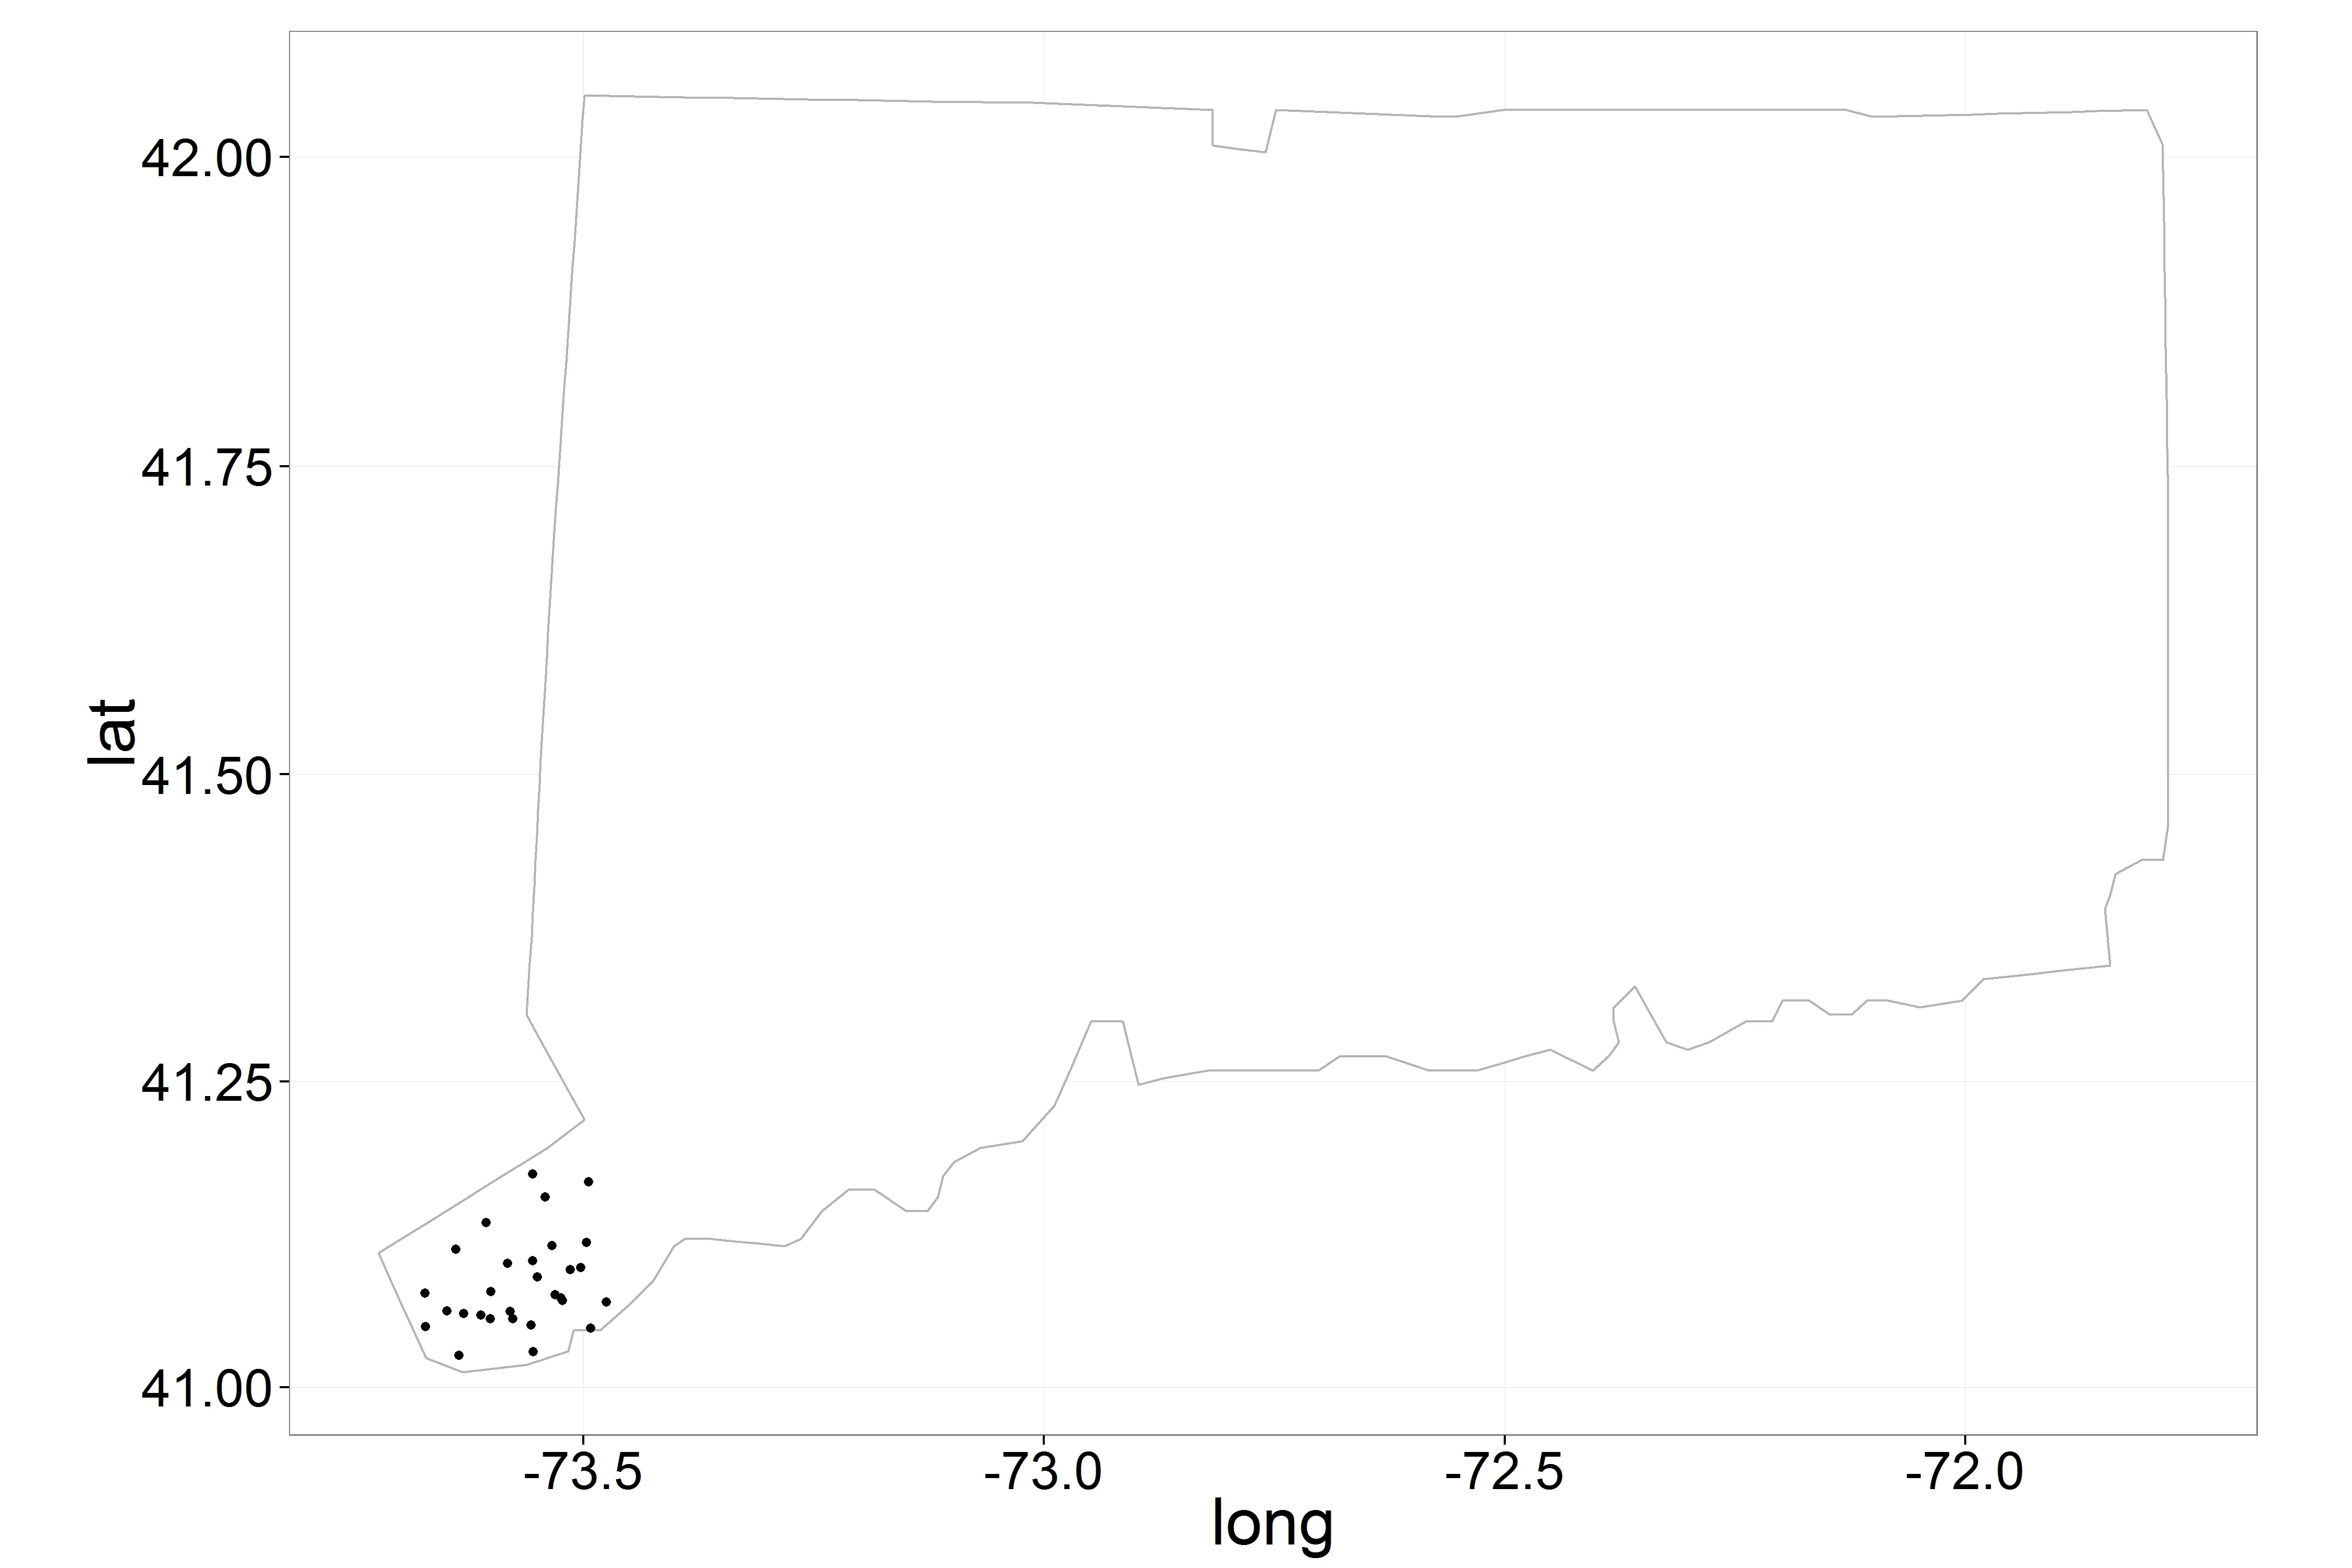
有没有办法让地图上抖动的点都在地图边界内?在下面的例子中,康涅狄格州西南部的抖动位置会出现在水域或相邻的州,有没有办法让R抖动位置点但不超过地图边界?
或者,是否有其他技术可以创建一个表格Grob,在每个城市附近列出公司名称?
# create a data frame called "ct" of geolocations in two cities near the border of a US state (Connecticut).  Each firm has the same lat and longitude of one of the two cities

> dput(ct)
structure(list(city = structure(c(1L, 1L, 1L, 1L, 1L, 2L, 2L, 
2L, 2L, 2L, 2L, 2L, 2L, 2L, 2L, 2L, 2L, 2L, 2L, 2L, 2L, 2L, 2L, 
2L, 2L, 2L, 2L), .Label = c("Greenwich", "Stamford"), class = "factor"), 
    firm = structure(c(1L, 12L, 21L, 22L, 23L, 24L, 25L, 26L, 
    27L, 2L, 3L, 4L, 5L, 6L, 7L, 8L, 9L, 10L, 11L, 13L, 14L, 
    15L, 16L, 17L, 18L, 19L, 20L), .Label = c("A1", "A10", "A11", 
    "A12", "A13", "A14", "A15", "A16", "A17", "A18", "A19", "A2", 
    "A20", "A21", "A22", "A23", "A24", "A25", "A26", "A27", "A3", 
    "A4", "A5", "A6", "A7", "A8", "A9"), class = "factor"), long = c(-73.63, 
    -73.63, -73.63, -73.63, -73.63, -73.55, -73.55, -73.55, -73.55, 
    -73.55, -73.55, -73.55, -73.55, -73.55, -73.55, -73.55, -73.55, 
    -73.55, -73.55, -73.55, -73.55, -73.55, -73.55, -73.55, -73.55, 
    -73.55, -73.55), lat = c(41.06, 41.06, 41.06, 41.06, 41.06, 
    41.09, 41.09, 41.09, 41.09, 41.09, 41.09, 41.09, 41.09, 41.09, 
    41.09, 41.09, 41.09, 41.09, 41.09, 41.09, 41.09, 41.09, 41.09, 
    41.09, 41.09, 41.09, 41.09)), .Names = c("city", "firm", 
"long", "lat"), row.names = c(NA, -27L), class = "data.frame")


library(ggplot2)
# load the map of the United States
all_states <- map_data("state")
# choose to map the borders only of the state of Connecticut
st.map <- subset(all_states, region == "connecticut")

# plot the points for the firms with minimal jitter that still distinguishes each point
ggplot(ct, aes(long, lat)) + 
  geom_polygon(data=st.map, aes(x=long, y=lat, group = group), colour="grey70", fill="white") +
  coord_map() + 
  geom_point(position=position_jitter(width=.1, height=.1), size=2)

enter image description here

在这个问题中,每次微调经度或纬度都不会起作用,因为有太多的点,我希望有一种算法解决方案,因为我有许多情况可能出现拥挤和越界。感谢任何建议或答案。

https://stackoverflow.com/questions/22943110/jitter-coordinates

2个回答

8
您可以制作自己的抖动函数,以使数据抖动。然后使用来自SDMTools的pnt.in.poly函数检查点是否位于多边形内部。否则,您只需再次抖动原始点即可。以下是一个示例:
require(SDMTools)
bounded_jitter <- function(mapping, data, bounds, width, height, ...){
  # data2 is the jittered data
  data2 <- data
  data2[, paste(mapping$x)] <- rnorm(nrow(data), data[, paste(mapping$x)], width/1.96)
  data2[, paste(mapping$y)] <- rnorm(nrow(data), data[, paste(mapping$y)], height/1.96)
  # is it inside the polygon?
  idx <- as.logical(pnt.in.poly(pnts = data2[, c(paste(mapping$x), paste(mapping$y))],  
                                poly.pnts = bounds)[, 'pip'])
  while(!all(idx)) { # redo for points outside polygon
    data2[!idx, paste(mapping$x)] <- rnorm(sum(!idx), data[!idx, paste(mapping$x)], width/1.96)
    data2[!idx, paste(mapping$y)] <- rnorm(sum(!idx), data[!idx, paste(mapping$y)], height/1.96)
    idx <- as.logical(pnt.in.poly(pnts = data2[, c(paste(mapping$x), paste(mapping$y))],  
                                  poly.pnts = bounds)[, 'pip'])
  }
  # the point
  geom_point(data = data2, mapping, ...)
}
# plot the points for the firms with minimal jitter that still distinguishes each point
ggplot(ct, aes(long, lat)) + 
  geom_polygon(data=st.map, aes(x=long, y=lat, group = group), colour="grey70", fill="white") +
  coord_map() + 
  geom_point(size=2) + 
  bounded_jitter(mapping = aes(x=long, y=lat), 
                 data = ct, 
                 bounds = st.map[, c('long', 'lat')], 
                 width = .1, 
                 height = .1)

resulting plot: Connecticut with jittered points inside


哇,这是一个很棒的函数。如果这个函数存在于一个包中就太好了!+1 - jazzurro
1
@shadow,这很酷!但如果我有很多州都存在这种情况,并且不知道哪些州会出现不合适的抖动怎么办?我的实际用例有数千个位置位于数百个城市,其中许多靠近海洋、湖泊或州界。我该如何让R检测边界穿越并在需要时调用该函数? - lawyeR

1
自这篇文章首次发布以来,已经出现了一些工具,特别是sf包,它与tidyverse包非常兼容,并且对应的ggplot2::geom_sf也很好用。我将使用sf对象代替多边形来处理空间操作,下载州和城镇边界(tigris从人口普查局下载形状文件并返回sf对象),并转换坐标。请注意保留HTML标签。
library(dplyr)
library(sf)
library(ggplot2)
sf_use_s2(FALSE)
#> Spherical geometry (s2) switched off

state_sf <- tigris::states(cb = TRUE) %>%
  filter(STUSPS == "CT")
town_sf <- tigris::county_subdivisions("CT", cb = TRUE)
pts_sf <- ct_pts %>%
  mutate(geometry = purrr::map2(long, lat, ~st_point(x = c(.x, .y)))) %>%
  st_as_sf(crs = st_crs(state_sf))

版本1的方法是在每个不同点周围采用循环缓冲区(因为我注意到您的原始数据集中重复出现了看起来像市镇中心的地方),然后将其遮罩以适应州界限。

circle_buff <- pts_sf %>%
  distinct(city, geometry) %>%
  st_buffer(dist = 0.1) %>%
  st_intersection(state_sf)

ggplot() +
  geom_sf(data = state_sf, fill = "white") +
  geom_sf(aes(fill = city), data = circle_buff, color = NA, alpha = 0.4)

然后,您可以通过在这些多边形内进行采样,在每个城镇中取与原始数据集中观测数量相同的点来创建抖动点。

set.seed(10)
jitter1 <- ct_pts %>%
  select(city) %>%
  inner_join(circle_buff, by = "city") %>%
  group_by(city) %>%
  summarise(geometry = suppressMessages(st_sample(geometry, size = n()))) %>%
  ungroup() %>%
  st_as_sf()

ggplot() +
  geom_sf(data = state_sf, fill = "white") +
  geom_sf(aes(color = city), data = jitter1, size = 0.8, alpha = 0.8)

请注意,由于缓冲区跨越城镇边界并重叠,因此在重叠区域中,斯坦福德点和格林威治点可能占据部分相同的空间。第二版通过镇边界而不仅仅是州来掩盖缓冲区,因此可供两个城镇采样的区域不再重叠。对于此示例,我缩小了缓冲距离,只是为了说明有缓冲边界既在城镇内部又在城镇边界外部——也就是说,每个城镇可用于采样的空间既在城镇内部,也在缓冲半径内。
town_buff <- pts_sf %>%
  distinct(city, geometry) %>%
  st_buffer(dist = 0.07) %>%
  split(.$city) %>%
  purrr::imap_dfr(~st_intersection(.x, town_sf %>% filter(NAME == .y)))

jitter2 <- ct_pts %>%
  select(city) %>%
  inner_join(town_buff, by = "city") %>%
  group_by(city) %>%
  summarise(geometry = suppressMessages(st_sample(geometry, size = n()))) %>%
  ungroup() %>%
  st_as_sf()

ggplot() +
  geom_sf(data = state_sf, fill = "white") +
  geom_sf(aes(color = city), data = jitter2, size = 0.8, alpha = 0.8)


网页内容由stack overflow 提供, 点击上面的
可以查看英文原文,
原文链接