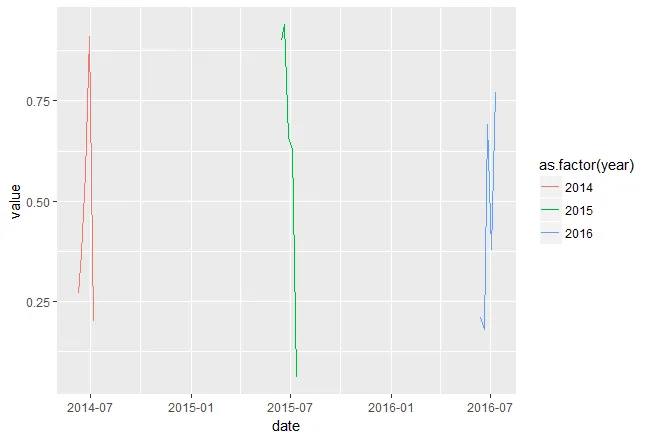
我有一个类似于以下玩具数据的数据框:
df <- structure(list(year = c(2014, 2014, 2014, 2014, 2014, 2015, 2015,
    2015, 2015, 2015, 2016, 2016, 2016, 2016, 2016), date = structure(c(16229,
    16236, 16243, 16250, 16257, 16600, 16607, 16614, 16621, 16628,
    16964, 16971, 16978, 16985, 16992), class = "Date"), value = c(0.27,
    0.37, 0.57, 0.91, 0.2, 0.9, 0.94, 0.66, 0.63, 0.06, 0.21, 0.18,
    0.69, 0.38, 0.77)), .Names = c("year", "date", "value"), row.names = c(NA,
    -15L), class = c("tbl_df", "tbl", "data.frame"))
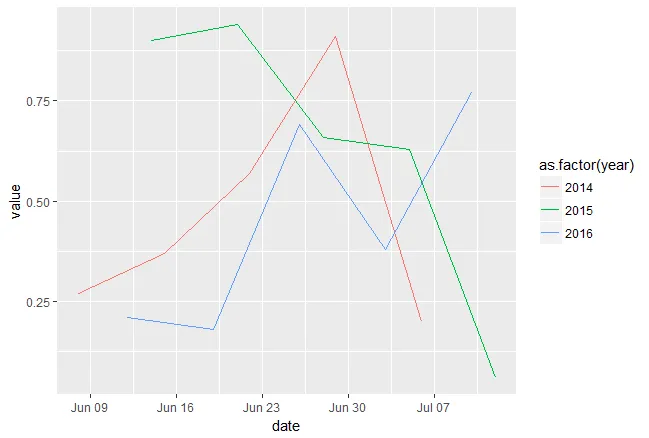
其中value是一些感兴趣的值,year和date是不言自明的。如果我想在不同年份中直观地比较value,那么date中的不同年份会使得图表变得不太有用。
library(tidyverse)
ggplot(df, aes(date, value, color = as.factor(year))) +
  geom_line()
使用lubridate,我可以更改date中的年份,如下所示,这样可以起作用:
# This works
library(lubridate)
df2 <- df

year(df2$date) <- 2014

ggplot(df2, aes(date, value, color = as.factor(year))) +
  geom_line()
但在 dplyr 链中进行更改会很有帮助,类似于以下内容:
df3 <- df %>%
  mutate(year(date) = 2014)
但是这段代码返回一个错误
错误: 在以下内容中有意外的“=”:"df3 <- df %>% mutate(year(date) ="
在 dplyr 链中是否有方法使其正常工作,还是我只需在链之外进行编辑?
mutate(df, date = \lubridate::year<-`(date, 2014))` 会出错。 - MCornejolubridate::\year<-`` - Axeman