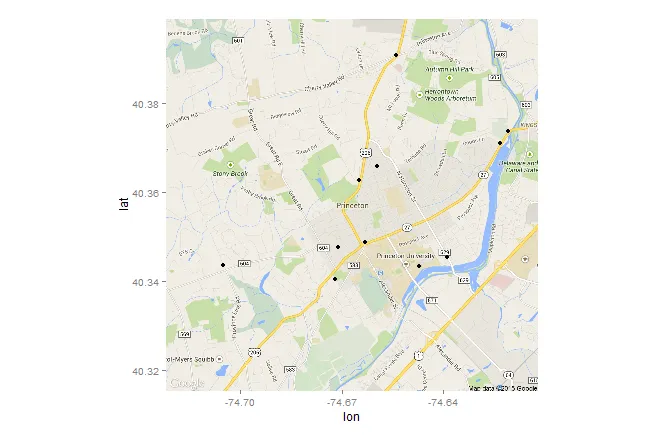
我在普林斯顿的各个位置记录了交通计数的数据框。
# dput(count)
structure(list(intersection = structure(c(11L, 9L, 10L, 12L,
6L, 3L, 7L, 2L, 4L, 1L, 5L, 8L), .Label = c("CherryHillat206",
"ElmatRidgeRd", "FacultyatHarrison", "HarrisonatLake", "HarrisonbetwHamilton",
"MerceratLoversLane", "ProvinceLineatMercer", "RiverRdat27",
"Rt 27 Bank", "Rt. 27 River Rd", "US206 Cambelton", "US206Princeton Ave."
), class = "factor"), traffic = c(19352, 18697, 12493, 21554,
10871, 13310, 7283, 11408, 12055, 6415, 14100, 5739), lat = c(40.3475418,
40.3487282, 40.3711205, 40.3909988, 40.3403702, 40.3434601, 40.343689,
40.3440514, 40.3454819, 40.3627014, 40.3658734, 40.3738098),
lon = c(-74.6711197, -74.6630707, -74.62323, -74.6541214,
-74.6720123, -74.647049, -74.7051392, -74.7334671, -74.6390533,
-74.6648483, -74.6596518, -74.6207962), class = structure(c(1L,
1L, 1L, 1L, 2L, 2L, 2L, 2L, 2L, 2L, 2L, 2L), .Label = c("primary",
"secondary"), class = "factor")), .Names = c("intersection",
"traffic", "lat", "lon", "class"), row.names = c(NA, -12L), class = "data.frame")

library(ggplot2)
library(ggmap)

map <- get_map(location = 'princeton', zoom = 13, maptype = "road")

ggmap(map) +
geom_point(data = count, aes(x = lon, y = lat)) +
annotate("text", x = -74.7, y = 40.4, label = "TEST anno")
早期的问题1与另一个包中的annotate发生冲突的解决方法并不实用.另一种解决方法是创建另一个数据框。
根据评论进行编辑--我收到的错误信息:
Error: 'x' and 'units' must have length > 0
这里是图表,展示了坐标轴的边界。
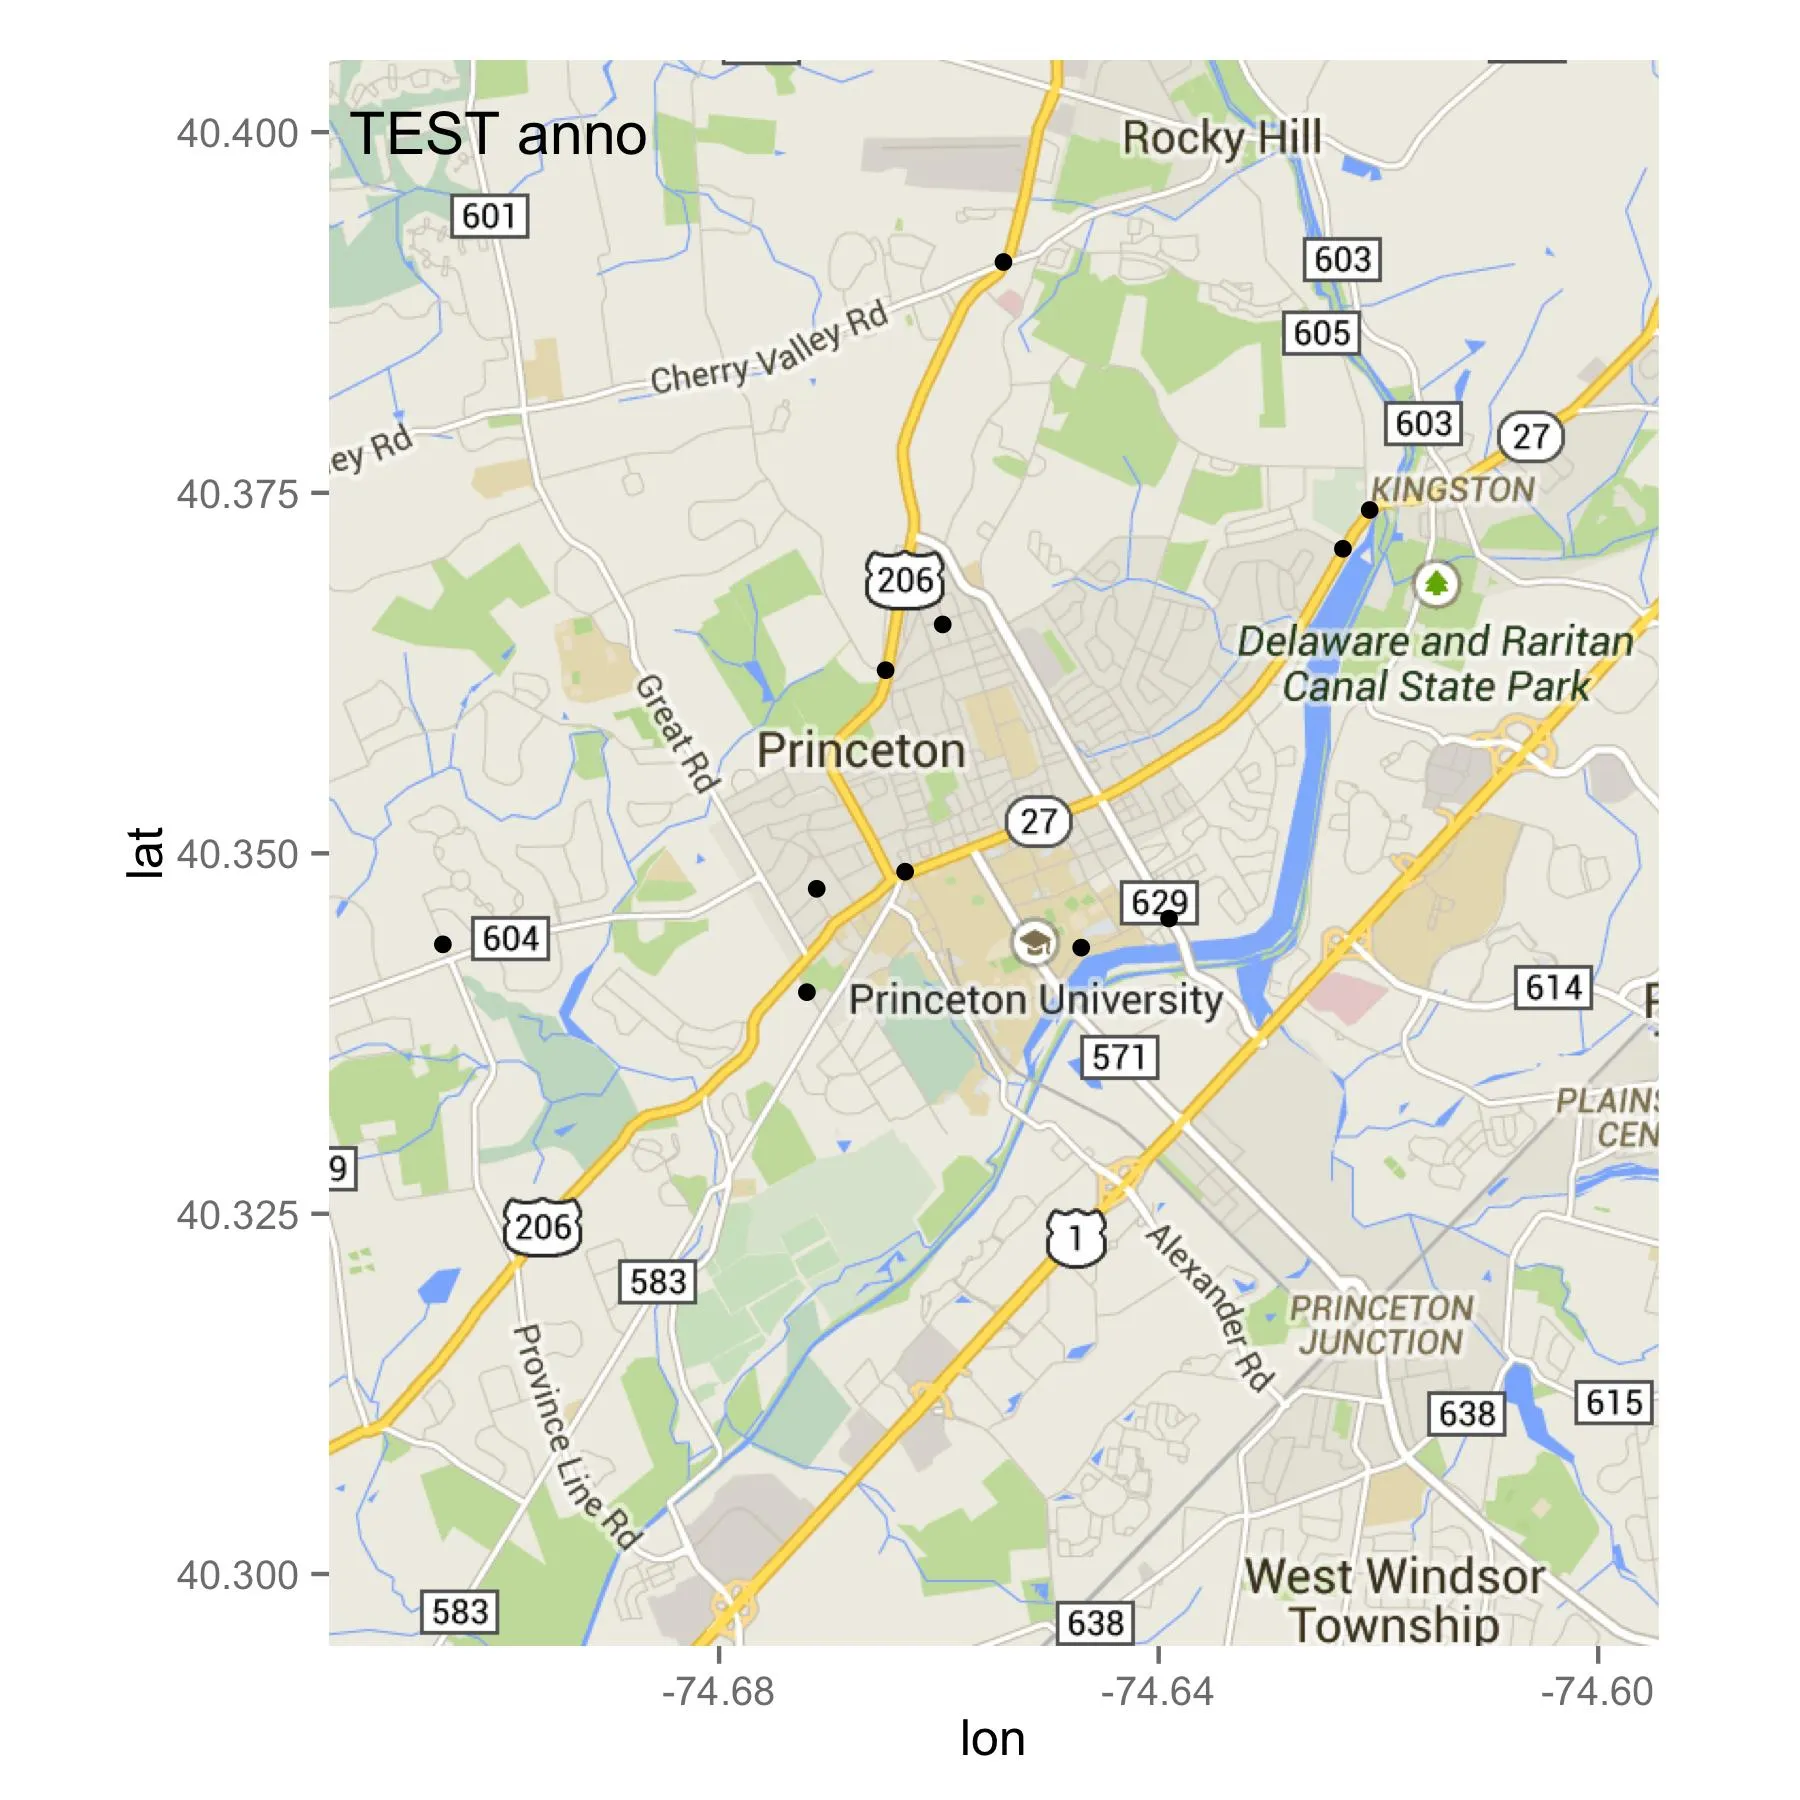
错误:ggplot2不知道如何处理类函数的数据。 - rmuc8map2 <- get_map(location = 'princeton', zoom = 12, maptype = "road")。至少,我能够按照您的意图看到文本。鉴于此,我仍然认为您尝试注释的点在地图中不存在。 - jazzurro