我已经找了很长时间,想要在Windows上使用IntelliJ和Chrome来调试Angular应用程序。
目前我无法将调试器连接到Chrome。我尝试了使用--remote-debugging-port=9222启动Chrome以及许多其他解决方案。
我目前使用的是IntelliJ 2020.2和Chrome 86。
有人有Windows上的解决方案吗?
我已经找了很长时间,想要在Windows上使用IntelliJ和Chrome来调试Angular应用程序。
目前我无法将调试器连接到Chrome。我尝试了使用--remote-debugging-port=9222启动Chrome以及许多其他解决方案。
我目前使用的是IntelliJ 2020.2和Chrome 86。
有人有Windows上的解决方案吗?
我在使用Mac,但我认为这可能对你有所帮助,因为它解决了我的问题。
解决方法是前往:
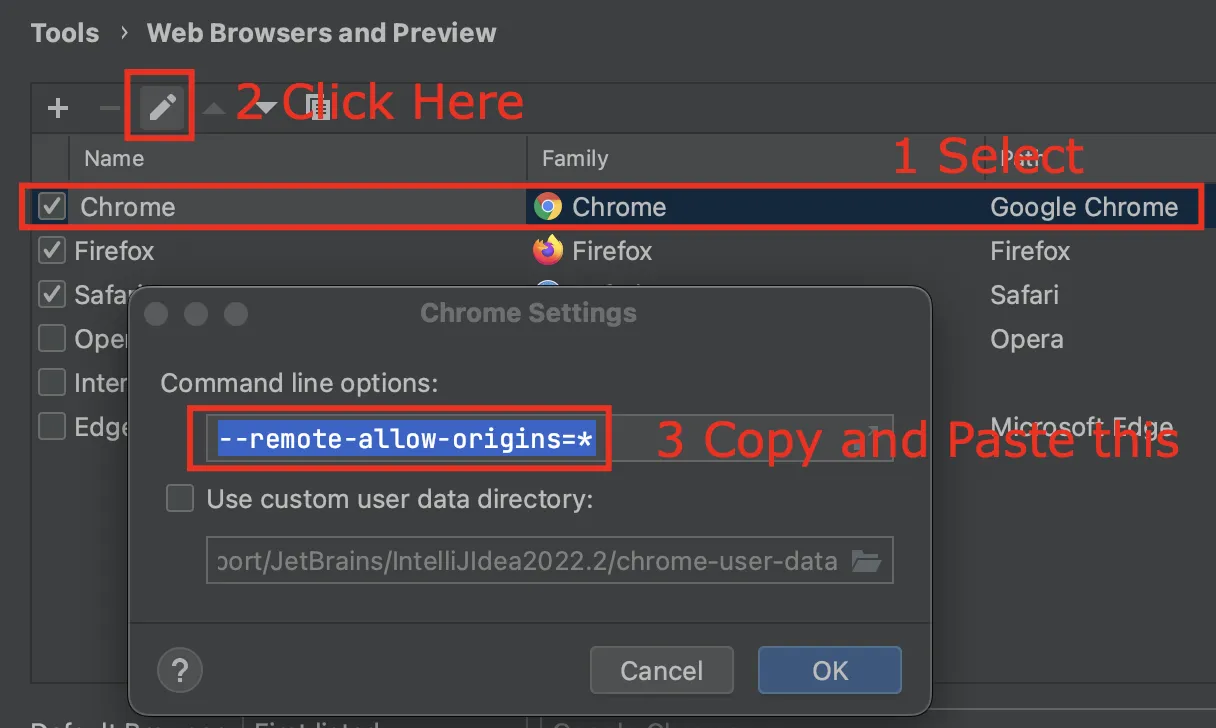
设置 -> 工具 -> 网络浏览器和预览
编辑Chrome条目,并在命令行选项中输入--remote-allow-origins=*。
~\AppData\Roaming\JetBrains\WebStorm2020.2\options\other.xml
~\AppData\Roaming\JetBrains\WebStorm2020.2\options\web-browsers.xml
永远记得备份您的文件。
请按照帮助中描述的步骤进行操作:
npm start启动您的应用程序http://localhost:4200/或类似的URL)另请参阅https://blog.jetbrains.com/webstorm/2017/01/debugging-angular-apps/
--remote-debugging-port选项启动Chrome的结果是什么? - lena--remote-debugging-port=9222,还是没有成功。调试器无法附加到任何 Chrome 进程上。IntelliJ 启动的 Chrome 会话都出现了问题,都崩溃了。 - Georg H.
%APPDATA%\JetBrains\WebStorm2022.2\options使用~语法没有任何有用的效果,只是打开了一个新的浏览器窗口。 - Cee McSharpface