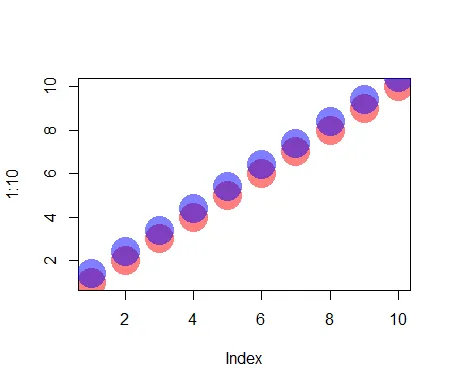
我有一个三列矩阵,根据第一列和第二列的值以点为基础进行绘制,但根据第二列(六个不同组)进行染色。我可以成功地绘制出所有的点,然而,最后一个绘图组(组6)被分配了紫色,掩盖了其他组的绘图点。是否有办法使绘图点更加透明?
s <- read.table("/.../parse-output.txt", sep="\t")
dim(s)
[1] 67124     3
x <- s[,1]
y <- s[,2]
z <- s[,3]
cols <- cut(z, 6, labels = c("pink", "red", "yellow", "blue", "green", "purple"))
plot(x, y, main= "Fragment recruitment plot - FR-HIT", ylab = "Percent identity", xlab = "Base pair position", col = as.character(cols), pch=16)
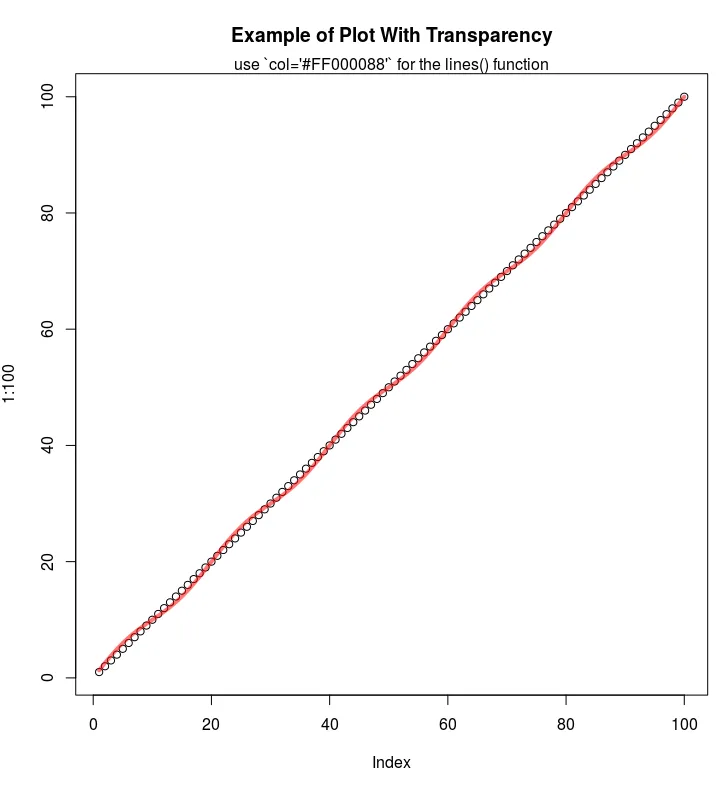
scales不是标准包,您可能需要事先安装它。 - normanius