我的问题非常简单。假设我有一个带有列标题的数据文件,如下所示:
first second
1 1
2 1
3 6
4 9
plot datafile using 1:2
我如何将x轴标记为first,y轴标记为second?
编辑:我知道可以使用列标题作为关键条目通过set key auto title column head,但这不完全是我要找的。
我的问题非常简单。假设我有一个带有列标题的数据文件,如下所示:
first second
1 1
2 1
3 6
4 9
plot datafile using 1:2
我如何将x轴标记为first,y轴标记为second?
编辑:我知道可以使用列标题作为关键条目通过set key auto title column head,但这不完全是我要找的。
为了更详细地说明@andyras的建议,以下是您可以实现的方法:
datafile = 'filename.txt'
firstrow = system('head -1 '.datafile)
set xlabel word(firstrow, 1)
set ylabel word(firstrow, 2)
plot datafile using 1:2
using 语句进行绘图,否则 gnuplot 会抱怨 bad data on line 1。另一个人们认为无法使用gnuplot完成的问题。这里有一个简单的仅使用gnuplot解决方案,不需要外部工具,因此跨平台。
数据:SO16089301.dat
first second
1 1
2 1
3 6
4 9
### extracting axes labels from datafile
reset
FILE = 'SO16089301.dat'
stats FILE u (myX=strcol(1), myY=strcol(2)) every ::0::0 nooutput
set xlabel myX
set ylabel myY
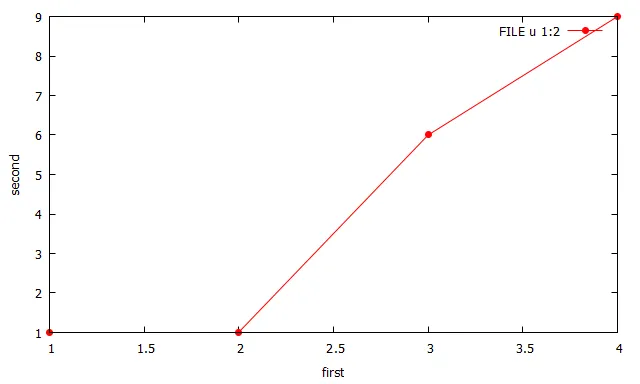
plot FILE u 1:2 w lp pt 7 lc rgb "red"
### end of script
结果:
我认为它是被支持的。你只需要能够使用双引号:
plot 'file' using "first":"second"
不过,如果你想在using规范中进行数学计算,你也需要使用column("")函数
plot 'file' using "first":(column("second")-(column("thrid"))
(对于我来说,仅使用带引号的标题名称进行计算并不起作用)