如何在Python中创建渐变色?

73

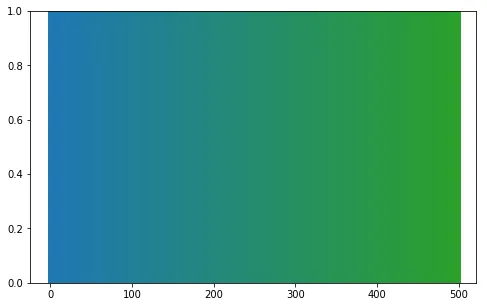
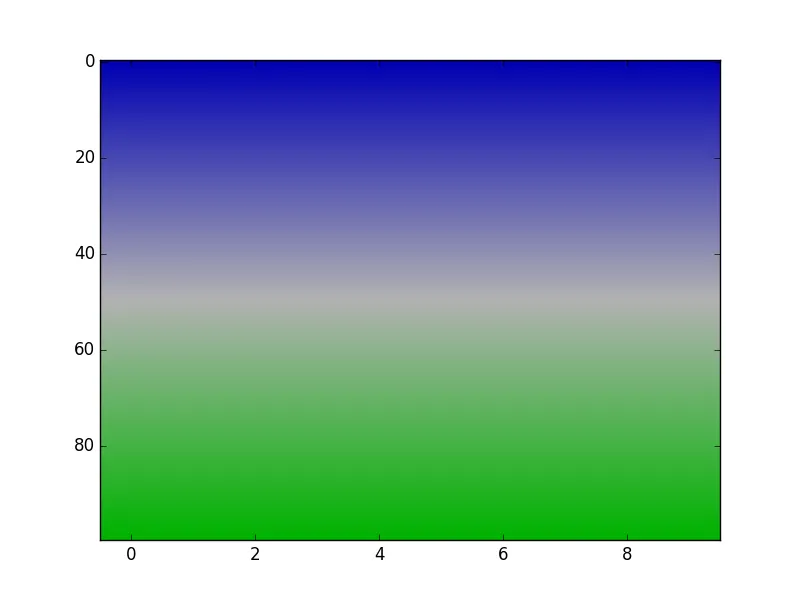
我想创建一种新的颜色地图,可以在绿色和蓝色(或其他两种颜色)之间进行插值。我的目标是获得像这样的效果:gradient

首先,我真的不确定是否可以使用蓝色和绿色的线性插值来实现这个目标。如果可以,我不知道该如何操作。我在这里找到了一些使用matplotlib方法插入指定RGB值的文档。

真正麻烦的是理解下面的“cdict2”是如何工作的。例如,文档中说:

“举个例子:假设您希望红色在底半部分从0增加到1,在中间半部分绿色也这样做,在顶部半部分则使用蓝色。那么您将使用以下代码:”

from matplotlib import pyplot as plt
import matplotlib 
import numpy as np

plt.figure()
a=np.outer(np.arange(0,1,0.01),np.ones(10))
cdict2 = {'red':   [(0.0,  0.0, 0.0),
                   (0.5,  1.0, 1.0),
                   (1.0,  1.0, 1.0)],
         'green': [(0.0,  0.0, 0.0),
                   (0.25, 0.0, 0.0),
                   (0.75, 1.0, 1.0),
                   (1.0,  1.0, 1.0)],
         'blue':  [(0.0,  0.0, 0.0),
                   (0.5,  0.0, 0.0),
                   (1.0,  1.0, 1.0)]} 
my_cmap2 = matplotlib.colors.LinearSegmentedColormap('my_colormap2',cdict2,256)
plt.imshow(a,aspect='auto', cmap =my_cmap2)                   
plt.show()

编辑:我现在明白了插值是如何工作的,例如,这将给出从红色到白色的插值:

从白色到红色:对于每种颜色,按照“矩阵”的列向下进行,第一列是我们想要插值开始和结束的x坐标,另外两列是该坐标处颜色值的实际值。

cdict2 = {'red':   [(0.0,  1.0, 1.0),
                    (1.0,  1.0, 1.0),
                    (1.0,  1.0, 1.0)],
         'green': [(0.0,  1.0, 1.0),
                   (1.0, 0.0, 0.0),
                   (1.0,  0.0, 0.0)],
     'blue':  [(0.0,  1.0, 1.0),
               (1.0,  0.0, 0.0),
               (1.0,  0.0, 0.0)]} 

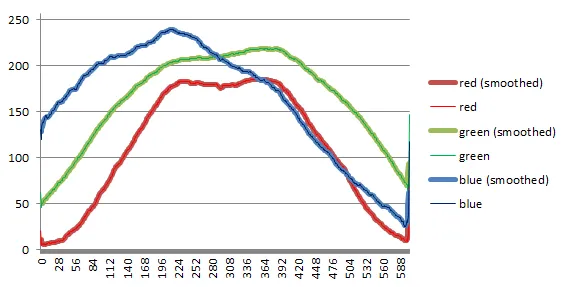
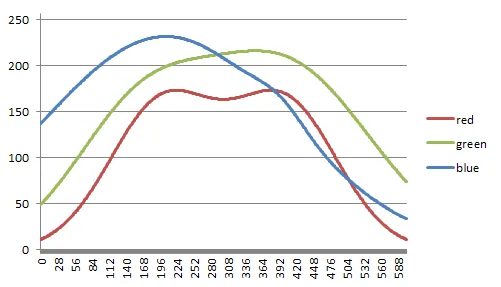
显然,在RGB空间内插值创建我需要的渐变将非常困难...


请查看这个链接:http://matplotlib.org/examples/color/named_colors.html。它展示了不同命名颜色的代码,并且介绍了它们之间的转换方式。另外,我认为这个链接:http://matplotlib.org/examples/api/colorbar_only.html 有关于色条的内容也会很有帮助。 - mauve
1
你是怎么创建那个渐变的例子的?它远非线性。 - Mark Ransom
1
是的,绝对没错,这只是一张屏幕截图,说明了我想要的东西。我并没有创建它。我在想Python是否有一些函数可以方便地实现这些渐变效果... - Dipole
2
截图来自于什么呢? - Mark Ransom
如果这有帮助的话,我可以尝试找到我从哪张幻灯片上得到的信息,但我只记得它是一些关于“这是一个颜色渐变示例”的内容。 - Dipole
10个回答

136

我还没有看到的一个简单答案是只需使用color package

通过pip安装

pip install colour

使用方法如下:

from colour import Color
red = Color("red")
colors = list(red.range_to(Color("green"),10))
    
# colors is now a list of length 10
# Containing: 
# [<Color red>, <Color #f13600>, <Color #e36500>, <Color #d58e00>, <Color #c7b000>, <Color #a4b800>, <Color #72aa00>, <Color #459c00>, <Color #208e00>, <Color green>]

将输入更改为您想要的任何颜色。正如@zelusp所指出的,这 不会 限制自己只在两种颜色之间进行平滑组合(例如,从红色到蓝色将在中间具有黄色+绿色),但基于赞数,很明显许多人发现这是一个有用的近似值。


4
这种方法生成的渐变色会经过其他颜色形成一个渐变 - 不是只由两种颜色组成的真正渐变 - 例如,使用此方法从红色到蓝色将生成黄色和绿色。 - zelusp
10
这个网页是一份关于Python中颜色渐变的绝佳资源。 - zelusp
至少包名与示例拼写正确...;p - Hayden Thring
这是一个HSV渐变。作者可以在答案或代码中指定。否则,做得很好。 - Captain Trojan

59

如果您只需要在两种颜色之间进行插值,我为此编写了一个简单的函数。colorFader可以从两个十六进制颜色代码中生成另一个十六进制颜色代码。

import matplotlib as mpl
import matplotlib.pyplot as plt
import numpy as np

def colorFader(c1,c2,mix=0): #fade (linear interpolate) from color c1 (at mix=0) to c2 (mix=1)
    c1=np.array(mpl.colors.to_rgb(c1))
    c2=np.array(mpl.colors.to_rgb(c2))
    return mpl.colors.to_hex((1-mix)*c1 + mix*c2)

c1='#1f77b4' #blue
c2='green' #green
n=500

fig, ax = plt.subplots(figsize=(8, 5))
for x in range(n+1):
    ax.axvline(x, color=colorFader(c1,c2,x/n), linewidth=4) 
plt.show()

结果:

在Python中进行简单的颜色混合

由于兴趣高涨而更新:

colorFader现在可用于RGB颜色和颜色字符串,如'red'或'r'。


1
这个程序出现了错误,对于c1='#ff0000' #红色和c2='#001dff' #蓝色的处理失败了。 - Parthiban Rajendran
@Ulf Alsak:感谢您让我知道!在执行之前,您是否更改了我的代码?也许您可以举个例子说明hex(a)的内容是什么? - Markus Dutschke
1
是的!我实际上在上面的注释中写错了,我是指 hex(a)[2:-1]。在我的环境中,hex 返回的字符串以 "L" 结尾,你不想包含它,因此需要减去 "-1"。 - Ulf Aslak
1
@Ulf Alsak:已经完全更新。应该在您的系统上也能正常工作 ;) - Markus Dutschke
1
@Eddy axhline - Markus Dutschke
显示剩余3条评论

41

很明显,您原始的梯度示例不是线性的。看一下图像中红、绿和蓝色值的平均值的图表:

example gradient graph

试图使用线性渐变的组合来重新创建这个图形将会很困难。

对我来说,每种颜色看起来像是两个高斯曲线相加,所以我进行了一些拟合,得到了这个结果:

simulated

使用这些计算出的值,可以创建一个与您的梯度几乎完全匹配的非常漂亮的渐变。

import math
from PIL import Image
im = Image.new('RGB', (604, 62))
ld = im.load()

def gaussian(x, a, b, c, d=0):
    return a * math.exp(-(x - b)**2 / (2 * c**2)) + d

for x in range(im.size[0]):
    r = int(gaussian(x, 158.8242, 201, 87.0739) + gaussian(x, 158.8242, 402, 87.0739))
    g = int(gaussian(x, 129.9851, 157.7571, 108.0298) + gaussian(x, 200.6831, 399.4535, 143.6828))
    b = int(gaussian(x, 231.3135, 206.4774, 201.5447) + gaussian(x, 17.1017, 395.8819, 39.3148))
    for y in range(im.size[1]):
        ld[x, y] = (r, g, b)

重新创建的渐变

不幸的是,我还不知道如何将其推广到任意颜色。


谢谢Mark,这太棒了。我也一直在尝试不同的曲线,但正如你所说,我很难找到任何通用于任意颜色的方法。也许看看这里创建的一些标准Python渐变 http://wiki.scipy.org/Cookbook/Matplotlib/Show_colormaps 会有所帮助,尽管我找不到显示它们是如何创建的代码。 - Dipole

11

我也需要这个,但我想输入多个任意颜色点。考虑到需要黑色、蓝色、绿色等一直到“热”颜色的热度图。我使用了上面Mark Ransom的代码,并将其扩展以满足我的需求。我非常满意。特别感谢所有人,特别是马克。

该代码对图像大小是中立的(高斯分布没有常数); 您可以通过width=参数将其更改为pixel()。它还允许调整分布的“扩散”(-> stddev); 您可以通过将spread =参数更改为pixel()来进一步混淆它们或引入黑色带。

#!/usr/bin/env python

width, height = 1000, 200

import math
from PIL import Image
im = Image.new('RGB', (width, height))
ld = im.load()

# A map of rgb points in your distribution
# [distance, (r, g, b)]
# distance is percentage from left edge
heatmap = [
    [0.0, (0, 0, 0)],
    [0.20, (0, 0, .5)],
    [0.40, (0, .5, 0)],
    [0.60, (.5, 0, 0)],
    [0.80, (.75, .75, 0)],
    [0.90, (1.0, .75, 0)],
    [1.00, (1.0, 1.0, 1.0)],
]

def gaussian(x, a, b, c, d=0):
    return a * math.exp(-(x - b)**2 / (2 * c**2)) + d

def pixel(x, width=100, map=[], spread=1):
    width = float(width)
    r = sum([gaussian(x, p[1][0], p[0] * width, width/(spread*len(map))) for p in map])
    g = sum([gaussian(x, p[1][1], p[0] * width, width/(spread*len(map))) for p in map])
    b = sum([gaussian(x, p[1][2], p[0] * width, width/(spread*len(map))) for p in map])
    return min(1.0, r), min(1.0, g), min(1.0, b)

for x in range(im.size[0]):
    r, g, b = pixel(x, width=im.size[0], map=heatmap)
    r, g, b = [int(256*v) for v in (r, g, b)]
    for y in range(im.size[1]):
        ld[x, y] = r, g, b

im.save('grad.png')

这是由此代码生成的多点渐变:

由此代码生成的多点渐变

10

enter image description here

这是一种非常紧凑的创建色图的方式。 另请参阅LinearSegmentedColormap的文档。
import matplotlib as mpl
import matplotlib.pylab as plt

cmap0 = mpl.colors.LinearSegmentedColormap.from_list(
        'green2red', ['green', 'orangered'])
cmap1 = mpl.colors.LinearSegmentedColormap.from_list(
        'unevently divided', [(0, 'b'), (.3, 'gray'), (1, 'green')])

# plot
fig, axs = plt.subplots(2, 1)
norm = mpl.colors.Normalize(vmin=0, vmax=1)
cbar = axs[0].figure.colorbar(
            mpl.cm.ScalarMappable(norm=norm, cmap=cmap0),
            ax=axs[0], fraction=.1)
cbar = axs[1].figure.colorbar(
            mpl.cm.ScalarMappable(norm=norm, cmap=cmap1),
            ax=axs[1], fraction=.1)
plt.show()

这是其中最简单的方法之一,却常常被人忽视。mpl.colors.LinearSegmentedColormap.from_list('b2g', ['royalblue', 'w', 'forestgreen']) - H. Rev.

8
每个元组的第一个元素(0,0.25,0.5等)表示颜色应该是某个值的位置。我取了5个样本来查看RGB组件(在GIMP中),并将它们放在表格中。 RGB组件从0到1变化,因此我必须将它们除以255.0来缩放正常的0-255值。
这5个点是相当粗略的近似值 - 如果您想要更“平滑”的外观,请使用更多的值。
from matplotlib import pyplot as plt
import matplotlib 
import numpy as np

plt.figure()
a=np.outer(np.arange(0,1,0.01),np.ones(10))
fact = 1.0/255.0
cdict2 = {'red':  [(0.0,   22*fact,  22*fact),
                   (0.25, 133*fact, 133*fact),
                   (0.5,  191*fact, 191*fact),
                   (0.75, 151*fact, 151*fact),
                   (1.0,   25*fact,  25*fact)],
         'green': [(0.0,   65*fact,  65*fact),
                   (0.25, 182*fact, 182*fact),
                   (0.5,  217*fact, 217*fact),
                   (0.75, 203*fact, 203*fact),
                   (1.0,   88*fact,  88*fact)],
         'blue':  [(0.0,  153*fact, 153*fact),
                   (0.25, 222*fact, 222*fact),
                   (0.5,  214*fact, 214*fact),
                   (0.75, 143*fact, 143*fact),
                   (1.0,   40*fact,  40*fact)]} 
my_cmap2 = matplotlib.colors.LinearSegmentedColormap('my_colormap2',cdict2,256)
plt.imshow(a,aspect='auto', cmap =my_cmap2)                   
plt.show()

请注意,红色相当明显。这是因为中心区域接近灰色 - 这是三个组件必需的原因。
这会产生以下结果:上述表格的结果

1
+1 鼓励你独具匠心,我从未考虑过实际对组件进行采样。只是好奇,如果元祖中的第一个值表示位置,第二个值表示值,为什么字典中每个组件都需要有第三列?第三列代表什么? - Dipole
@Jack:这两个值允许颜色映射中的不连续性。如果一个点是(x0, yleft, yright),则当x增加到x0时,颜色映射会接近于yleft,而当x减少到x0时,它会接近于yright - Warren Weckesser
太好了,非常感谢!我必须承认,这比我之前想象的要复杂得多。使用您的方法,只要我有一个可用的梯度来获取组件值,我就可以得到我想要的东西。但是,如果我想为红色和绿色等创建一些类似的东西呢?我猜那不会那么简单。 - Dipole

7

这将创建一个由单个参数 y 控制的颜色映射:

from matplotlib.colors import LinearSegmentedColormap


def bluegreen(y):
    red = [(0.0, 0.0, 0.0), (0.5, y, y), (1.0, 0.0, 0.0)]
    green = [(0.0, 0.0, 0.0), (0.5, y, y), (1.0, y, y)]
    blue = [(0.0, y, y), (0.5, y, y),(1.0,0.0,0.0)]
    colordict = dict(red=red, green=green, blue=blue)
    bluegreenmap = LinearSegmentedColormap('bluegreen', colordict, 256)
    return bluegreenmap
红色从0逐渐增加到y,然后再逐渐减少到0。绿色从0逐渐增加到y,然后保持不变。蓝色y开始,在前半部分保持不变,然后逐渐减少到0。

下图显示了y = 0.7的情况:

bluegreen color map

您可以通过添加另一个或两个段来平滑它。


感谢您提供这个很好的例子。正如您所指出的那样,需要进行一些平滑处理。目前我们只有两个分段线性函数在中点处“镜像”。我想理想情况是有两个非线性函数也在中点处“镜像”,并且在接近零点时相交? - Dipole
是的,就像那样。@jcoppens有一个更精细的例子。 - Warren Weckesser

0

值得一提的是,这里有一种简洁的numpy方法可以在两种颜色之间进行插值:

def h_kernel(shape):
    row = np.linspace(0, 1, shape[1])
    kernel_1d = np.tile(row, (shape[0], 1))
    kernel_3d = cv2.merge((kernel_1d, kernel_1d, kernel_1d))
    return kernel_3d


def v_kernel(shape):
    kernel = h_kernel((shape[1], shape[0], shape[2]))
    return cv2.rotate(kernel, cv2.cv2.ROTATE_90_CLOCKWISE)


def gradient(shape, c1, c2, kernel_func):
    im = np.zeros(shape)
    kernel = h_kernel(shape)
    im = kernel * c1 + (1 - kernel) * c2
    return im.astype(np.uint8)

shape = (540, 960)
c1 = np.array((182, 132, 69))  # bgr
c2 = np.array((47, 32, 9))
h_gradient = gradient(shape, c1, c2, h_kernel)
v_gradient = gradient(shape, c1, c2, v_kernel)
cv2.imwrite("h.png", h_gradient)
cv2.imwrite("v.png", v_gradient)

enter image description here

enter image description here


为什么垂直的那个不工作!!?? - MSI
糟糕,imshow函数的参数不完整。我已经修复了。 - elbashmubarmeg

0

也许这个链接可以帮助您解决问题,感谢代码作者redjack001

from PIL import Image

#set the size of the new image
w = 500
h = 200

#start creating gradient
pixel_list = []
pixel_w = []

#colour at 0,0
start1 = (255,255,255)
s = list(start1)
pixel_list.append(start1)
print('Position zero:', pixel_list[0])

#colour at end
end1 = (174,15,15)
e = list(end1)

#in case you want to change the final colour you could use f to adjust otherwise just keep it at 1
f = 1

#transition per line
r = (s[0] - e[0])/w*f
g = (s[1] - e[1])/w*f
b = (s[2] - e[2])/w*f

t = ()

for j in range (0,w):
    t = pixel_list[j]

    #convert pixel tuple to a list and recalculate
    li = list(t)
    li[0] = int(max((li[0] - r*j),0))
    li[1] = int(max((li[1] - g*j),0))
    li[2] = int(max((li[2] - b*j),0))
    z = (li[0],li[1],li[2])
    final_t = tuple(z)
    #print('final_t:', final_t) if you want to show the list of pixel values
    pixel_list[j] = final_t
    for i in range (0,h):
        pixel_w = []
        pixel_w.append(final_t)
        pixel_list.extend(pixel_w)

l = len(pixel_list)

print('Pixel_list:', pixel_list, l)


#remove the last item
del pixel_list[l-1:]

print('Reprint length:', len(pixel_list))

im = Image.new('RGB', (w,h))
im.putdata(pixel_list)
im.show()

结果在这里:

enter image description here


0

这是对J.Zhao帖子的变体,希望能够简化正在发生的事情

def generateGradientBackground(w_ori, h_ori, r, g, b, brightness=1, reverse=False):

    # generate a vertical gradient between a colour and white
    # create the 1st column 1 pixel wide with all the colour ranges needed
    # then copy this horizontally for as many pixels width needed

    if reverse:
        s = (255*brightness,255*brightness,255*brightness)
        e = (r*brightness,g*brightness,b*brightness)
    else:
        s = (r*brightness,g*brightness,b*brightness)
        e = (255*brightness,255*brightness,255*brightness)

    #transition per line
    r = (s[0] - e[0])/(h_ori-1)
    g = (s[1] - e[1])/(h_ori-1)
    b = (s[2] - e[2])/(h_ori-1)

    t = ()

    for h in range (h_ori):
        # get new pixel colour
        p = (
            int(max((s[0] - r*h),0)),
            int(max((s[1] - g*h),0)),
            int(max((s[2] - b*h),0))
        )

        hlist.append(p)
        
    # now we have all the pixels for 1 column

    for p in hlist:
        tp = ( (p,) * w_ori )
        pixel_list += list( tp )

    im = Image.new('RGB', (w_ori,h_ori))
    im.putdata(pixel_list)
    #im.show()
    #im.save("background.png")
    return im

网页内容由stack overflow 提供, 点击上面的
可以查看英文原文,
原文链接