我正在尝试创建具有多个系列的TreeMap,系列将与合并在一起绘制在图形上,但我希望每次只显示一个系列。基本上可以使用图例,但对于TreeMap,它显示值。
这是我正在努力工作的 jsfiddle,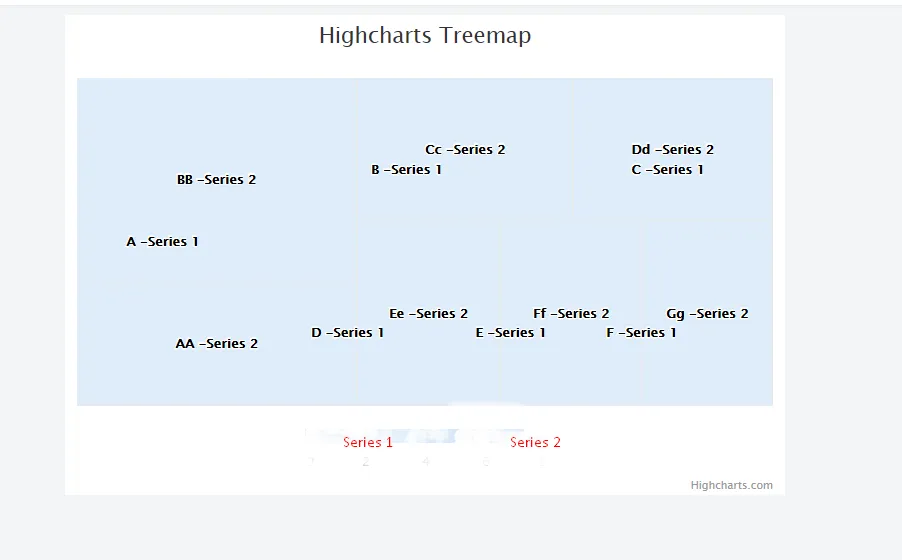
使用的JavaScript文件
根据所选系列更新矩形树图。
使用Highchart绑定。
这是我正在努力工作的 jsfiddle,
使用的JavaScript文件
<script src="https://code.highcharts.com/highcharts.js"></script>
<script src="https://code.highcharts.com/modules/heatmap.js"></script>
<script src="https://code.highcharts.com/modules/treemap.js"></script>
<div id="container"></div>
根据所选系列更新矩形树图。
使用Highchart绑定。
Highcharts.chart('container', {
    colorAxis: {
        minColor: '#FFFFFF',
        maxColor: Highcharts.getOptions().colors[0]
    },
    legend: {
        enabled: true,
    },
    series: [{
    name:"Series 1",
        stack: 'aeroplanes',
        type: 'treemap',
        layoutAlgorithm: 'squarified',
        data: [{
            name: 'A -Series 1',
            value: 6,
            colorValue: 1
        }, {
            name: 'B -Series 1',
            value: 6,
            colorValue: 2
        }, {
            name: 'C -Series 1',
            value: 4,
            colorValue: 3
        }, {
            name: 'D -Series 1',
            value: 3,
            colorValue: 4
        }, {
            name: 'E -Series 1',
            value: 2,
            colorValue: 5
        }, {
            name: 'F -Series 1',
            value: 2,
            colorValue: 6
        }, {
            name: 'G -Series 1',
            value: 1,
            colorValue: 7
        }]
    },
    // Second Series
    {
       name:"Series 2",
        type: 'treemap',
        stack: 'aeroplanes2',
        layoutAlgorithm: 'squarified',
        visible:true,
        data: [{
            name: 'AA -Series 2',
            value: 16,
            colorValue: 2
        }, {
            name: 'BB -Series 2',
            value: 26,
            colorValue: 2
        }, {
            name: 'Cc -Series 2',
            value: 14,
            colorValue: 2
        }, {
            name: 'Dd -Series 2',
            value: 13,
            colorValue: 2
        }, {
            name: 'Ee -Series 2',
            value: 12,
            colorValue: 2
        }, {
            name: 'Ff -Series 2',
            value: 12,
            colorValue: 2
        }, {
            name: 'Gg -Series 2',
            value: 11,
            colorValue: 2
        }]
    }],
    title: {
        text: 'Highcharts Treemap'
    },
      plotOptions: {
      treemap: {
        stacking: 'percent'
      }
    },
});