使用R中的Shiny,我正在尝试创建一个Leaflet地图,允许用户单击任何标记以生成表示该特定站点信息(温度)的相应图表。
我结合了这个问题的代码(Click on points in a leaflet map as input for a plot in shiny)和这个博客上的第二个技巧(https://www.r-bloggers.com/4-tricks-for-working-with-r-leaflet-and-shiny/),但仍然无法成功在Shiny中注册点击的标记点。
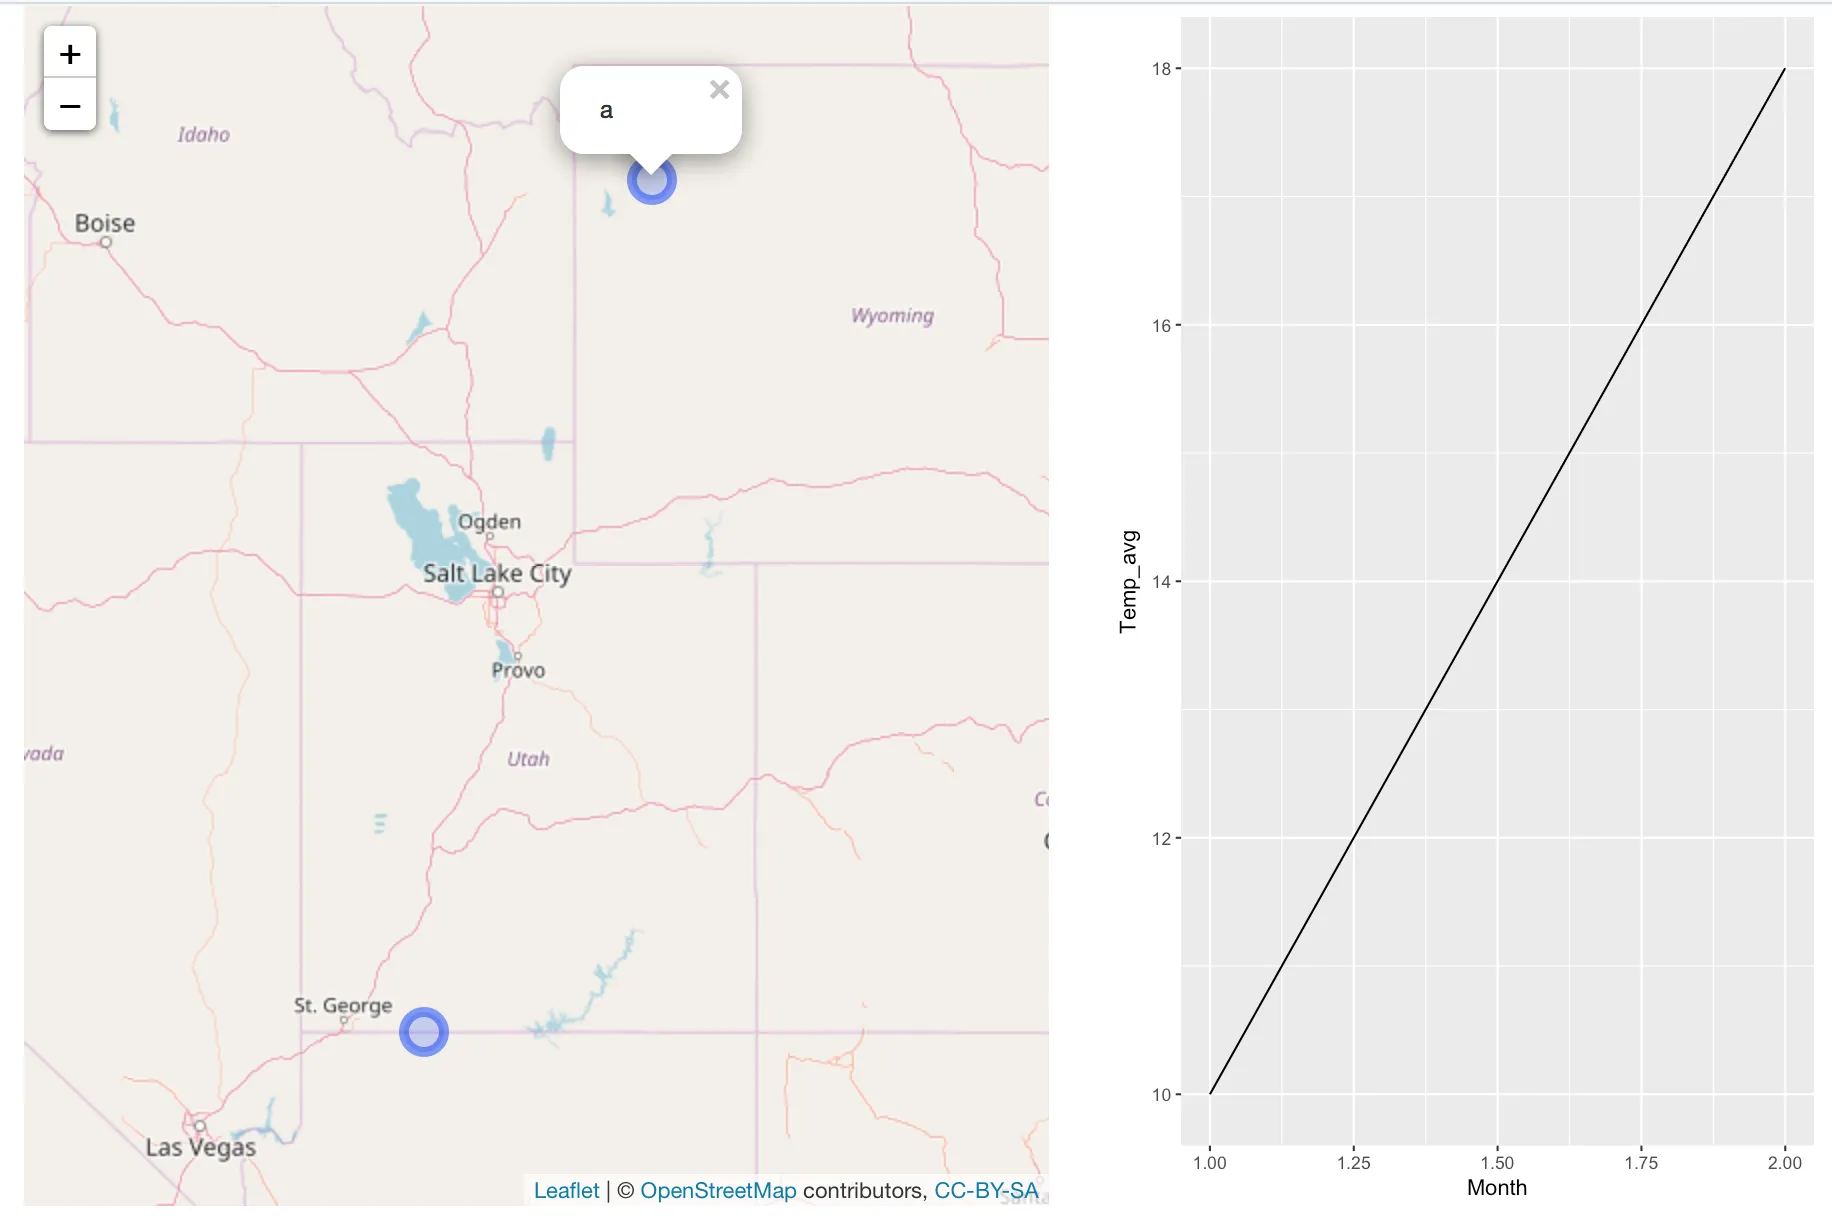
即,当我单击任何站点时,没有任何绘图。
根据进一步的研究,我找不到任何解决方案,欢迎任何帮助。
我结合了这个问题的代码(Click on points in a leaflet map as input for a plot in shiny)和这个博客上的第二个技巧(https://www.r-bloggers.com/4-tricks-for-working-with-r-leaflet-and-shiny/),但仍然无法成功在Shiny中注册点击的标记点。
即,当我单击任何站点时,没有任何绘图。
根据进一步的研究,我找不到任何解决方案,欢迎任何帮助。
library(leaflet)
library(shiny)
library(ggplot2)

# example data frame
wxstn_df <- data.frame(Site = c("a", "a", "b"), Latitude = c(44.1, 44.1, 37), Longitude = c(-110.2, -110.2, -112.7), Month = c(1,2,1), Temp_avg = c(10, 18, 12))

ui <- fluidPage(column(7, leafletOutput("wsmap", height = "600px")),
  column(5, plotOutput("plot", height = "600px"))
)

server <- function(input, output) {

  # create a reactive value to store the clicked site
  stn <- reactiveValues(clickedMarker = NULL)

  ## leaflet map
  output$wsmap <- renderLeaflet({
    leaflet() %>%
      addTiles() %>%
      addCircleMarkers(data = wxstn_df, ~unique(Longitude), ~unique(Latitude), layerId = ~unique(Site), popup = ~unique(Site))
  })

 # store the click
  observeEvent(input$map_marker_click, {
    stn$clickedMarker <- input$map_marker_click
  })

output$plot <- renderPlot({
      ggplot(wxstn_df[wxstn_df$Site %in% stn$clickedmarker$Site,], aes(Month, Temp_avg)) +
        geom_line()
  })
}

shinyApp(ui, server)