我在这里尝试实现的最终目标是将一个图形保存为.pdf格式,大小为特定尺寸(
通常我通过使用
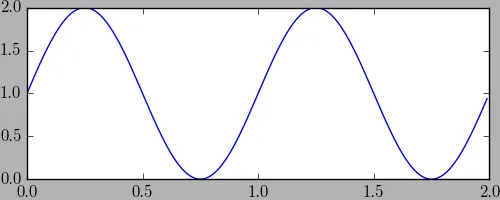
这将创建一个大小为5x2的漂亮pdf。
并生成以下图像,显然未使用`tight_layout`。
[5,2] 在下面的示例代码中),并且没有轴标签/刻度标签外的填充。通常我通过使用
figsize的组合来创建一个图形,并通过tight_layout将填充设置为零来实现这一点(我添加了灰色背景颜色以更好地显示边缘/填充)。fig = plt.figure(
figsize = [5,2],
tight_layout = {'pad': 0}
)
t = np.arange(0.0, 2.0, 0.01)
s = 1 + np.sin(2*np.pi*t)
plt.plot(t, s)
plt.savefig('figure.pdf', facecolor = (0.7,0.7,0.7))
这将创建一个大小为5x2的漂亮pdf。
但是,当我使用GridSpec创建子图时,我在处理其中一个图形时遇到了麻烦。奇怪的是,只有在为GridSpec设置自定义wspace时才会出现问题。
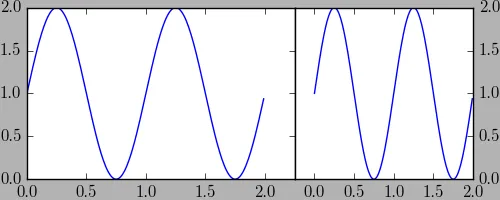
没有wspace的示例
fig, (ax0, ax1) = plt.subplots(
    nrows = 1, ncols = 2,
    gridspec_kw = {'width_ratios' : [3,2]},
    tight_layout = {'pad': 0},
    figsize = [5,2]
)

t = np.arange(0.0, 2.0, 0.01)
s = 1 + np.sin(2*np.pi*t)
ax0.plot(t, s)
ax1.plot(t, s)

ax1.yaxis.tick_right()

ax0.set_xlim([0, 2.25])
ax1.set_xlim([-0.25, 2])

plt.savefig('figure.pdf')
带有空格的示例
我添加了一些空格以在子图之间留出一些空间,因为它们在上面的示例中非常接近。
fig, (ax0, ax1) = plt.subplots(
    nrows = 1, ncols = 2,
    gridspec_kw = {'width_ratios' : [3,2], 'wspace' : 0.1},
    tight_layout = {'pad': 0},
    figsize = [5,2]
)

t = np.arange(0.0, 2.0, 0.01)
s = 1 + np.sin(2*np.pi*t)
ax0.plot(t, s)
ax1.plot(t, s)

ax1.yaxis.tick_right()

ax0.set_xlim([0, 2.25])
ax1.set_xlim([-0.25, 2])

plt.savefig('figure.pdf', facecolor = (0.7,0.7,0.7))
与上面唯一的变化是在gridspec_kw字典中添加了wspace
这导致savefig命令出现错误
C:\Users\<username>\Anaconda3\lib\site-packages\matplotlib\figure.py:1744:
UserWarning: This figure includes Axes that are not compatible with
tight_layout, so its results might be incorrect.
  warnings.warn("This figure includes Axes that are not "
# the warning is cut off here for some reason
并生成以下图像,显然未使用`tight_layout`。
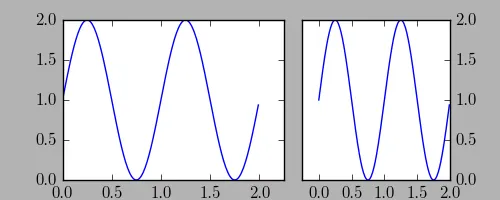
有人知道解决这个问题的方法吗?或者有更好的方法来实现我想做的事情吗?