从多边形的各边上绘制等距点

3
我正在绘制一个多边形,其顶点如下所示。
      x            y
-0.02208709 -0.039161304
 0.01184081 -0.020268029
 0.04578401 -0.001351904
 0.02210236  0.039176396
-0.01185226  0.020252146
-0.04578784  0.001352696

使用以下代码:
plot(x,y)
polygon(x,y)
points(mean(x),mean(y),col="red")

图像描述

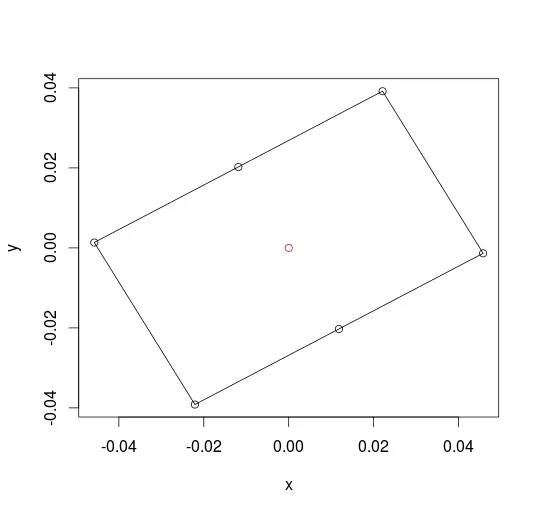
现在我想在多边形的边上绘制50个等间距的点。有什么建议吗?


1
从多边形中等距离生成50个随机点,还是在折线上均匀生成50个点? - jbaums
这里有50个点,它们与你的多边形边缘之间的距离都为0:new_x <- runif(50, -0.02, 0.01); points(new_x, -0.0268618 + 0.5568654*new_x, pch=20) - jbaums
1
@jbaums。感谢您指出这一点。我想要沿着折线均匀分布50个点。在问题中进行了澄清。 - Janak
1个回答

7

您可以使用sp包中的spsample来实现此操作。

首先,我们需要加载库并读取您的顶点数据。

library(sp)

xy <- read.table(text='x            y
-0.02208709 -0.039161304
0.01184081 -0.020268029
0.04578401 -0.001351904
0.02210236  0.039176396
-0.01185226  0.020252146
-0.04578784  0.001352696', header=TRUE)

现在从顶点创建一个SpatialLines对象。这有点混乱 - 如果你卡住了,请参阅?SpatialLines?`SpatialLines-Class`

l <- SpatialLines(list(Lines(Line(rbind(xy, xy[1, ])), ID=1)))

然后对这些点进行取样,并使用as.data.frame(pts)coordinates(pts)将其强制转换为data.frame

pts <- spsample(l, 50, type="regular")
coordinates(pts) # only the head shown here
##                 x           y
## [1,] -0.019343310 -0.03763339
## [2,] -0.014987452 -0.03520776
## [3,] -0.010631594 -0.03278213
## [4,] -0.006275735 -0.03035651
## [5,] -0.001919877 -0.02793088
## [6,]  0.002435981 -0.02550525

plot(l)
points(pts, pch=20)

enter image description here


网页内容由stack overflow 提供, 点击上面的
可以查看英文原文,
原文链接