为了自己画出平滑的损失曲线,我从Tensorboard下载了CSV文件。
目前我的代码如下:
import pandas as pd

import numpy as np

import seaborn as sns

import matplotlib.pyplot as plt

df = pd.read_csv('C:\\Users\\ali97\\Desktop\\Project\\Database\\Comparing Outlier Fractions\\10 Percent (MAE)\\MSE Validation.csv',usecols=['Step','Value'],low_memory=True)

df2 = pd.read_csv('C:\\Users\\ali97\\Desktop\\Project\\Database\\Comparing Outlier Fractions\\15 Percent (MAE)\\MSE Validation.csv',usecols=['Step','Value'],low_memory=True)

df3 = pd.read_csv('C:\\Users\\ali97\\Desktop\\Project\\Database\\Comparing Outlier Fractions\\20 Percent (MAE)\\MSE Validation.csv',usecols=['Step','Value'],low_memory=True)


plt.plot(df['Step'],df['Value'] , 'r',label='10% Outlier Frac.' )
plt.plot(df2['Step'],df2['Value'] , 'g',label='15% Outlier Frac.' )
plt.plot(df3['Step'],df3['Value'] , 'b',label='20% Outlier Frac.' )

plt.xlabel('Epochs')
plt.ylabel('Validation score')
plt.show()
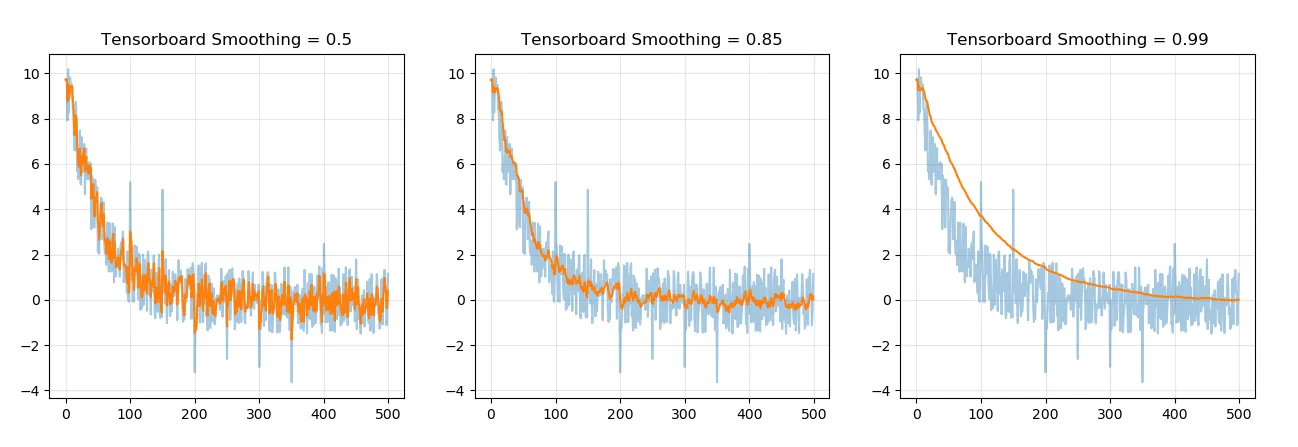
我在阅读有关如何平滑图表的内容时,发现这里的另一位成员编写了代码来展示tensorboard如何平滑图表,但我真的不知道如何在我的代码中实现它。
def smooth(scalars: List[float], weight: float) -> List[float]:  # Weight between 0 and 1
    last = scalars[0]  # First value in the plot (first timestep)
    smoothed = list()
    for point in scalars:
        smoothed_val = last * weight + (1 - weight) * point  # Calculate smoothed value
        smoothed.append(smoothed_val)                        # Save it
        last = smoothed_val                                  # Anchor the last smoothed value


    return smoothed
谢谢。