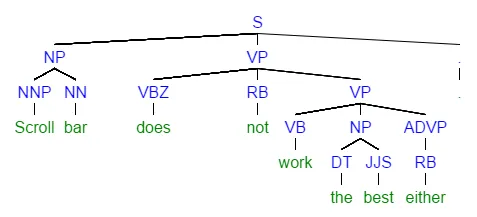
我希望能够展示来自openNLP的解析(POS标注)作为树形结构可视化。下面提供了来自openNLP的解析树,但我无法像Python解析那样绘制成通用的可视化树。
install.packages(
    "http://datacube.wu.ac.at/src/contrib/openNLPmodels.en_1.5-1.tar.gz",
    repos=NULL,
    type="source"
)

library(NLP)
library(openNLP)

x <- 'Scroll bar does not work the best either.'
s <- as.String(x)

## Annotators
sent_token_annotator <- Maxent_Sent_Token_Annotator()
word_token_annotator <- Maxent_Word_Token_Annotator()
parse_annotator <- Parse_Annotator()

a2 <- annotate(s, list(sent_token_annotator, word_token_annotator))
p <- parse_annotator(s, a2)
ptext <- sapply(p$features, `[[`, "parse")
ptext
Tree_parse(ptext)

## > ptext
## [1] "(TOP (S (NP (NNP Scroll) (NN bar)) (VP (VBZ does) (RB not) (VP (VB work) (NP (DT the) (JJS best)) (ADVP (RB either))))(. .)))"
## > Tree_parse(ptext)
## (TOP
##   (S
##     (NP (NNP Scroll) (NN bar))
##     (VP (VBZ does) (RB not) (VP (VB work) (NP (DT the) (JJS best)) (ADVP (RB either))))
##     (. .)))
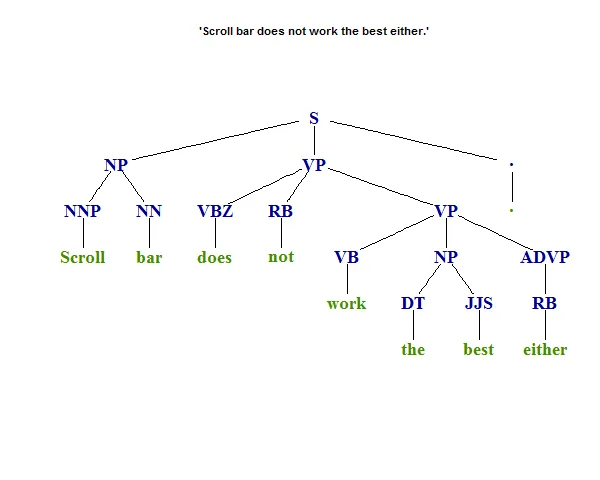
树形结构应该类似于这样:
有没有一种方法可以显示这个树形可视化?
我找到了与此相关的树形可视化问题 (链接),它可以用于绘制数值表达式,但我无法将其推广到句子解析可视化。