我在特定的场地绘制了16年碳通量的时间序列。我想让x轴显示年份(1992-2007),而不是年数(1-16)。当我将x轴设置为最小值1992和最大值2007时,图形没有出现在绘图中,但是如果不设置最小/最大年份,则会出现。我不确定我的问题出在哪里。我绘制了另一个一年的时间序列,并成功使用MonthLocator标记了x轴的月份,但无法使用YearLocator。以下是我的代码:
fig=pyplot.figure()
ax=fig.gca()
ax.plot_date(days,nee,'r-',label='model daily nee')
ax.plot_date(days,nee_obs,'b-',label='obs daily nee')
# locate the ticks
ax.xaxis.set_major_locator(YearLocator())
# format the ticks
ax.xaxis.set_major_formatter(DateFormatter('%Y'))
# set years 1992-2007
datemin = datetime.date(1992, 1, 1)
datemax = datetime.date(2007, 12, 31)
ax.set_xlim(datemin, datemax)
labels=ax.get_xticklabels()
setp(labels,'rotation',45,fontsize=10)
legend(loc="upper right", bbox_to_anchor=[0.98, 0.98],
ncol=1, shadow=True)
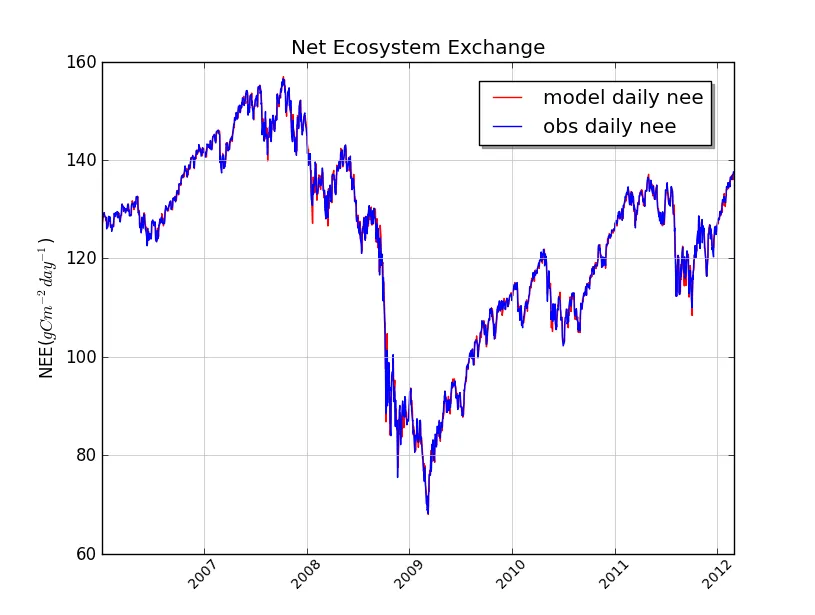
pyplot.ylabel('NEE($gC m^{-2} day^{-1}$)')
pyplot.title('Net Ecosystem Exchange')
pyplot.savefig('nee_obs_model_HF_daily.pdf')
# rotates and right aligns the x labels, and moves the bottom of the
# axes up to make room for them
#fig.autofmt_xdate()
pyplot.show()
pyplot.close()
days数组是如何构建的? - Andrey Sobolevdays、nee和nee_obs的一些示例数据?请同时发布您的导入,以便我不必寻找YearLocator和DateFormatter来自于matplotlib.dates,并且可以在pyplot中找到setp和legend。 - BioGeek