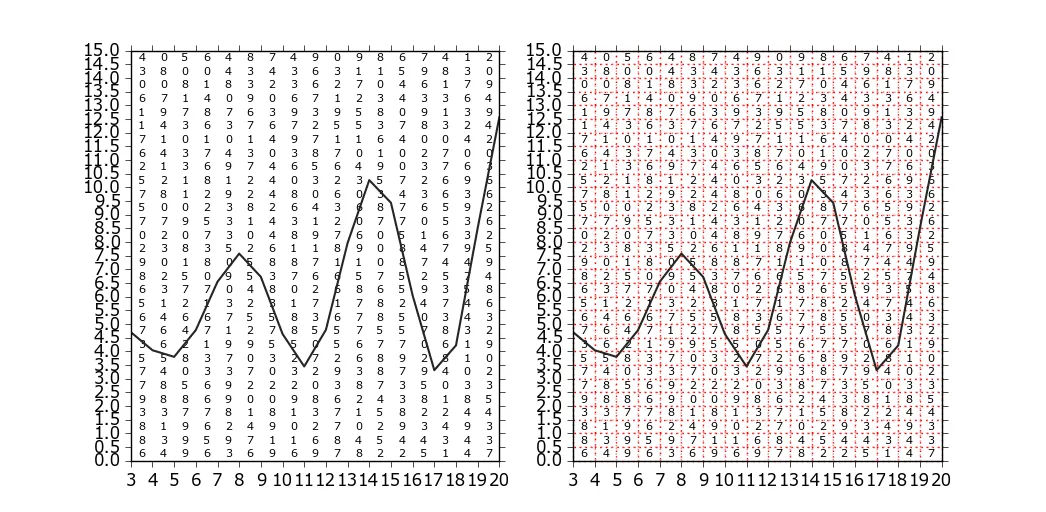
我有一个表格上的图表,如下面的示例所示。 表格数据由随机数字替换,实际绘图由某些任意函数替换:
import numpy as np
import matplotlib.pylab as plt

fig, ax = plt.subplots()

ntp = 17 # number of peak periods
nhs = 30 # number of wave heights

scatter_table = np.random.randint(0,10,(nhs,ntp)) # wave scatter diagram

tp = np.linspace(3,20,ntp+1) # peak period array
hs = np.linspace(0,15,nhs+1) # significant wave height

# axis limits to be in line with scatter diagram
ax.set_xlim((min(tp),max(tp)))
ax.set_ylim((min(hs),max(hs)))

# axis ticks as per scatter table bins
ax.set_xticks(tp)
ax.set_yticks(hs)

# matplotlib table
the_table = plt.table(cellText=scatter_table,loc=(0,0),cellLoc='center')

# change table properties to match plot window
table_props = the_table.properties()
table_cells = table_props['child_artists']
for cell in table_cells:
    cell.set_height(1/float(nhs))
    cell.set_width(1/float(ntp))

# plot!
ax.plot(tp,4+0.2*tp+np.sin(tp)*0.25*tp)

plt.grid()
plt.show()
我想问一下:是否有可能去掉表格的边框?或者,我可以将颜色改成浅灰色,并应用虚线样式。