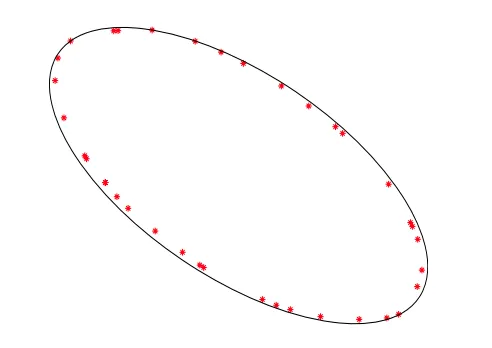
我编写了一个简单的函数来实现Mathieu David的解决方案。我相信有很多方法可以做到这一点,但这对我的应用程序起作用。
def get_ellipse_params(self, points):
''' Calculate the parameters needed to graph an ellipse around a cluster of points in 2D.
Calculate the height, width and angle of an ellipse to enclose the points in a cluster.
Calculate the width by finding the maximum distance between the x-coordinates of points
in the cluster, and the height by finding the maximum distance between the y-coordinates
in the cluster. Multiple both by a scale factor to give padding around the points when
constructing the ellipse. Calculate the angle by taking the inverse tangent of the
gradient of the regression line. Note that tangent solutions repeat every 180 degrees,
and so to ensure the correct solution has been found for plotting, add a correction
factor of +/- 90 degrees if the magnitude of the angle exceeds 45 degrees.
Args:
points (ndarray): The points in a cluster to enclose with an ellipse, containing n
ndarray elements representing each point, each with d elements
representing the coordinates for the point.
Returns:
width (float): The width of the ellipse.
height (float): The height of the ellipse.
angle (float): The angle of the ellipse in degrees.
'''
if points.ndim == 1:
width, height, angle = 0.1, 0.1, 0
return width, height, angle
else:
SCALE = 2.5
width = np.amax(points[:,0]) - np.amin(points[:,0])
height = np.amax(points[:,1]) - np.amin(points[:,1])
x_reg, y_reg = [[p[0]] for p in points], [[p[1]] for p in points]
grad = LinearRegression().fit(x_reg, y_reg).coef_[0][0]
angle = np.degrees(np.arctan(grad))
if angle < -45: angle += 90
elif angle > 45: angle -= 90
return width*SCALE, height*SCALE, angle
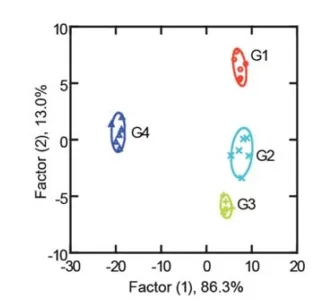 例如,一个组的数据集(例如红色组)可能如下所示: