我建议您查看霍夫变换(Hough Transformation):
https://uk.mathworks.com/help/images/hough-transform.html
您需要使用图像处理工具箱(Image Processing Toolbox)。否则,您需要开发自己的逻辑。
https://en.wikipedia.org/wiki/Hough_transform
更新1
我思考了两个小时,只能提取第一条曲线。问题在于定位曲线的起点。无论如何,这是我想出来的代码,希望能给您进一步开发提供一些想法。
clc;clear;close all;
grayImage = imread('2.png');
[rows, columns, numberOfColorBands] = size(grayImage);
if numberOfColorBands > 1
grayImage = grayImage(:, :, 2);
end
bw = edge(grayImage,'canny');
imshow(bw);
[x, y] = find(bw == 1);
P = [x,y];
cP = cell(1,length(x));
for i = 1:length(x)
px = x(i);
py = y(i);
dx = x - px*ones(size(x));
dy = y - py*ones(size(y));
distances = (dx.^2 + dy.^2).^0.5;
cP{i} = [x(distances == 1), y(distances == 1);
x(distances == sqrt(2)), y(distances == sqrt(2))];
end
fP = P(1,:);
Q(1,:) = fP;
Q(2,:) = cP{1}(1,:);
m = 2;
while true
pP = Q(m-1,:);
i = find(P(:,1) == Q(m,1) & P(:,2) == Q(m,2));
dx = cP{i}(:,1) - pP(1)*ones(length(cP{i}),1);
dy = cP{i}(:,2) - pP(2)*ones(length(cP{i}),1);
distances = (dx.^2 + dy.^2).^0.5;
m = m+1;
p_cache = cP{i}(find(distances==max(distances),1),:);
distance = ((p_cache(1) - fP(1))^2 + (p_cache(2) - fP(2))^2).^0.5;
if distance == 0 || distance == 1
break;
else
Q(m,:) = p_cache;
end
end
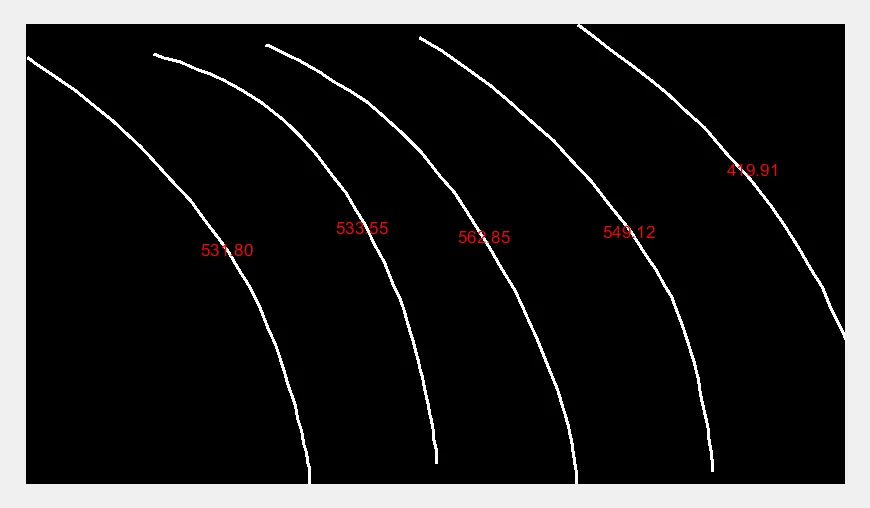
更新 2
自上次更新以来做了更多的工作。我现在能够分离每条曲线。我唯一看到的问题是如何拟合好曲线。我建议使用B样条或贝塞尔曲线而不是多项式拟合。我想我会在这里停下来,让你去解决剩下的问题。希望这能帮到你。
请注意,以下脚本使用图像处理工具箱查找曲线的边缘。
clc;clear;close all;
grayImage = imread('2.png');
[rows, columns, numberOfColorBands] = size(grayImage);
if numberOfColorBands > 1
grayImage = grayImage(:, :, 2);
end
bw = edge(grayImage,'canny');
imshow(bw);
[x, y] = find(bw == 1);
P = [x,y];
cP =[0,0];
for i = 1:length(x)
px = x(i);
py = y(i);
dx = x - px*ones(size(x));
dy = y - py*ones(size(y));
distances = (dx.^2 + dy.^2).^0.5;
c = [find(distances == 1); find(distances == sqrt(2))];
cP(end+1:end+length(c),:) = [ones(length(c),1)*i, c];
end
cP (1,:) = [];
cP = unique(sort(cP,2),'rows');
Q{1} = cP(1,:);
for i = 2:length(cP)
cp = cP(i,:);
for j = 1:length(Q)
check = ismember(cp,Q{j});
if ~any(check) && j == length(Q)
Q{end+1} = cp;
break;
elseif sum(check) == 2
break;
elseif sum(check) == 1
Q{j} = [Q{j}, cp(~check)];
break;
end
end
for j = 1:length(Q)-1
q = Q{j};
for m = j+1:length(Q)
check = ismember(q,Q{m});
if sum(check)>=1
Q{m} = [Q{m}, q(~check)];
Q{j} = [];
break;
end
end
end
Q = Q(~cellfun('isempty',Q));
end
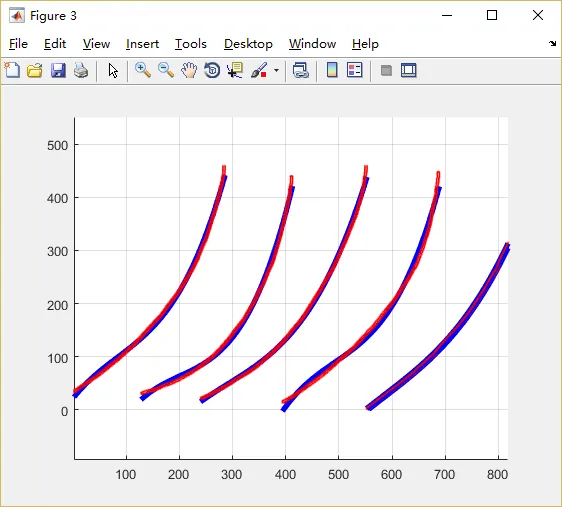
figure;hold on;axis equal;grid on;
for i = 1:length(Q)
x_ = x(Q{i});
y_ = y(Q{i});
coefficients = polyfit(y_, x_, 3);
fittedX = linspace(min(y_), max(y_), 500);
fittedY = polyval(coefficients, fittedX);
plot(fittedX, fittedY, 'b-', 'linewidth', 4);
plot(y_, x_, 'r.', 'LineWidth', 2, 'MarkerSize', 1)
formula = poly2sym([coefficients(1),coefficients(2),coefficients(3)]);
df=diff(formula);
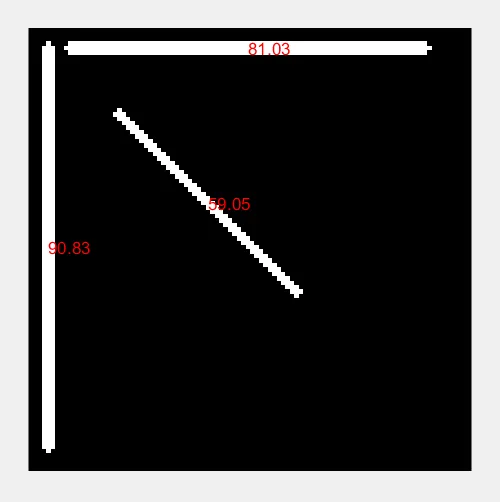
lengthOfCurve(i) = double(int((sqrt(1+df^2)),min(y_),max(y_)));
end
结果:
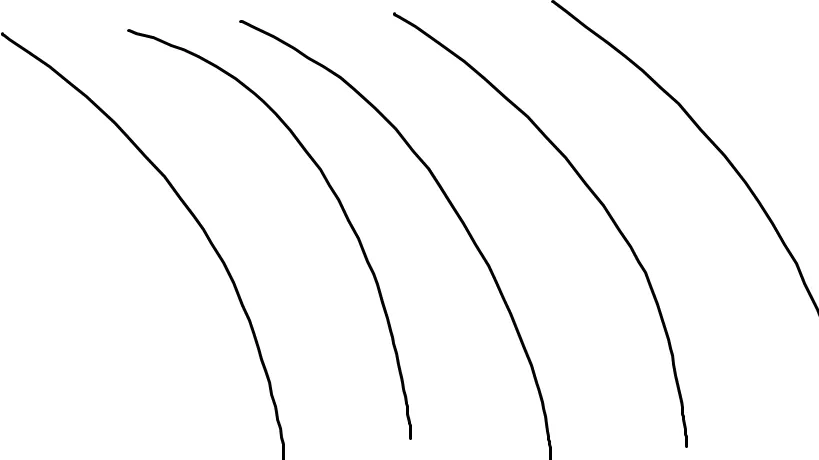
bw = edge(grayImage,'canny');需要使用 _图像处理工具箱_。如果您无法使用该工具箱,则可以在 边缘函数文档页面 的底部找到三个参考链接,您可以使用它们编写自己的边缘函数。 - Anthony