我(在Win7上)尝试使用leaflet包显示我的shapefile数据(这里是数据文件),但没有成功。我只能看到背景地图瓷砖,而看不到我的数据。然而,在QGIS中,我能够看到我的数据。下面的代码和描述来自这里。
library(rgdal)
shapeData <- readOGR(".",'myGIS')
ogrInfo(".",'myGIS')
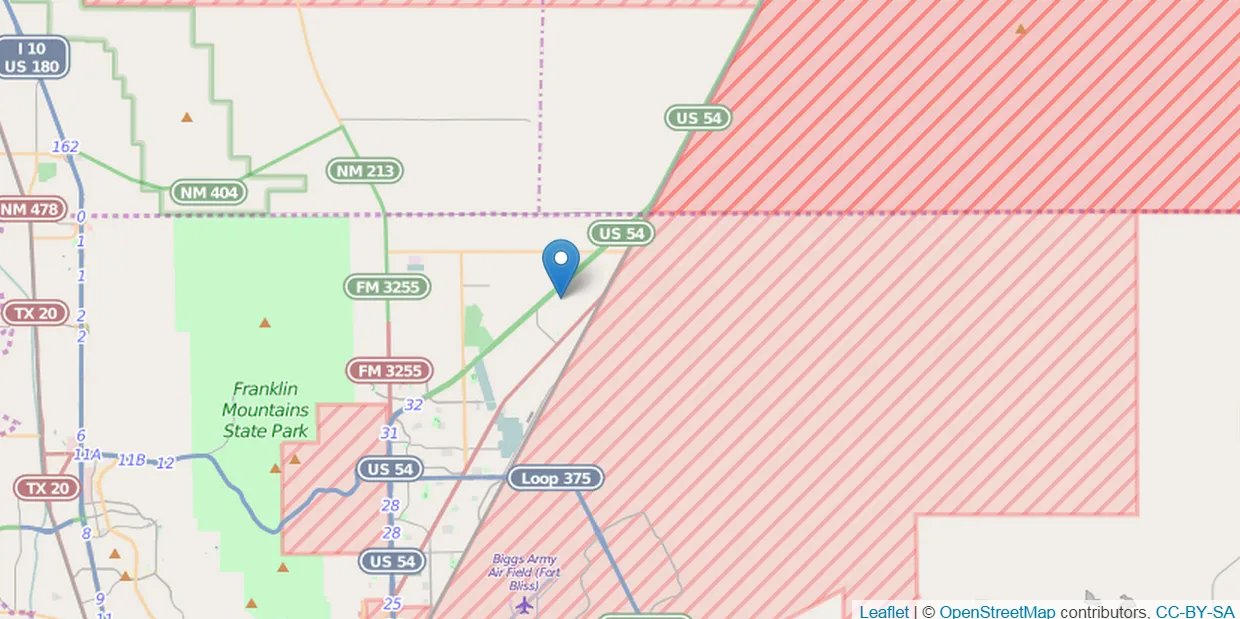
leaflet() %>% addTiles() %>% setView(lng = -106.363590, lat=31.968483,zoom=11) %>% addPolygons(data=shapeData,weight=5,col = 'red') %>% addMarkers(lng = -106.363590,lat=31.968483,popup="Hi there")
这是我在互联网浏览器中看到的。我没有看到shapeData被投影在上面:
x = st_read("shape file")读取形状文件,然后使用st_transform(x, '+proj=longlat +datum=WGS84')进行转换。 - Tony Ladson