使用
StatisticalGraphics 软件包:
using InMemoryDatasets
using StatisticalGraphics
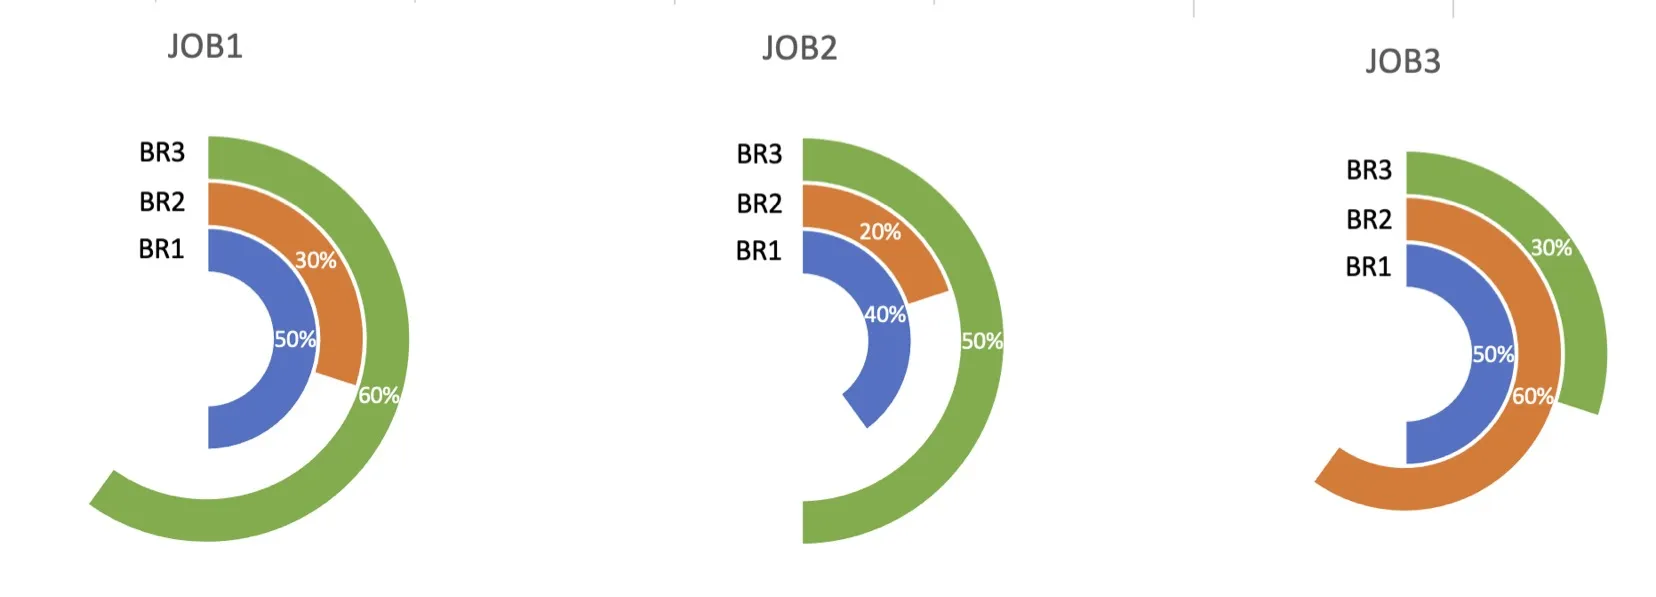
ds=Dataset(BR=["BR1","BR2","BR3"],JOB1=[.5,.3,.6],JOB2=[.4,.2,.5],JOB3=[.5,.6,.3])
ds2=transpose(gatherby(ds,:BR),r"JOB")
modify!(ds2,:_c1=>byrow(x->[x,1-x])=>:progress,:BR=>byrow(x->[x,missing])=>:cat)
flatten!(ds2,[:progress,:cat])
sgplot(
groupby(ds2,:_variables_),
Pie(category=:cat,response=:progress,group=:BR,innerradius=0.3, label=:percent,labelcolor=:white,colormodel=[:blue,:white,:orange,:green]),
layout=:row,headercolname=false,legend=false,width=200,height=200
)

R库,所以当然选项不适用于 Julia。据我所知,Python 或 Julia 没有现成的方法来实现这一点。 - jling