我有一张latex代码表格。
\begin{table}[c]
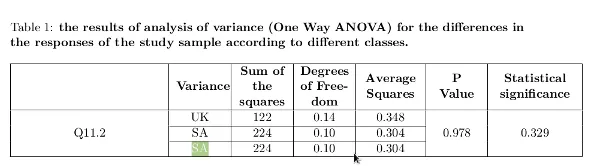
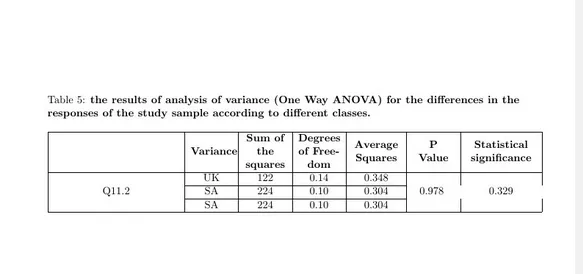
\caption{\textbf{the results of analysis of variance (One Way ANOVA)
for the differences in the responses of the study sample according
to different classes.}}
\bigskip
\centering
\begin{tabular} {|M{4.5cm}|M{1.5cm}|M{1.5cm}|M{1.5cm}|M{1.75cm}|M{1.5cm}|M{2.5cm}|}
\hline
\textbf{} & \textbf{Variance}
&\textbf{Sum of the squares } & \textbf{Degrees of Freedom } &
\textbf{Average Squares} &\textbf{P Value} &\textbf{Statistical significance } \\
\hline
\multirow{3}{*}{\makecell{Q11.2}} & UK &122 & 0.14 & 0.348 &
\multirow{3}{*}{\makecell{0.978} } & \multirow{3}{*}
{\makecell{0.329}}\\ \cline{2-5}
& SA & 224 & 0.10 & 0.304
\\ \cline{2-5}
& SA & 224 & 0.10 & 0.304
&& \\ \hline
\end{tabular}
\end{table}
我得到了这个输出
 :
:我不知道如何填充空的竖线!
我的代码有什么问题?