我想构建六边形图,其中每个区间都绘制了“落入此区间的类1和类2点之间比率”(对数或非对数)。
x <- rnorm(10000)
y <- rnorm(10000)
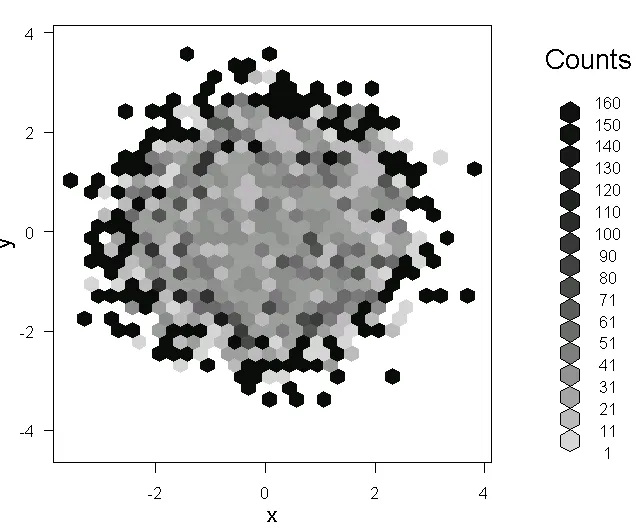
h <- hexbin(x,y)
plot(h)
l <- as.factor(c( rep(1,2000), rep(2,8000) ))
有没有关于如何实现这个的建议?是否有一种方法可以根据垃圾箱统计信息为每个垃圾箱引入功能?
我想构建六边形图,其中每个区间都绘制了“落入此区间的类1和类2点之间比率”(对数或非对数)。
x <- rnorm(10000)
y <- rnorm(10000)
h <- hexbin(x,y)
plot(h)
l <- as.factor(c( rep(1,2000), rep(2,8000) ))
@cryo111的回答拥有最重要的元素 - IDs = TRUE。接下来就只是需要找出你想要如何处理Inf以及需要将比率缩放多少才能得到产生漂亮图形的整数。
library(hexbin)
library(data.table)

set.seed(1)
x = rnorm(10000)
y = rnorm(10000)

h = hexbin(x, y, IDs = TRUE)

# put all the relevant data in a data.table
dt = data.table(x, y, l = c(1,1,1,2), cID = h@cID)

# group by cID and calculate whatever statistic you like
# in this case, ratio of 1's to 2's,
# and then Inf's are set to be equal to the largest ratio
dt[, list(ratio = sum(l == 1)/sum(l == 2)), keyby = cID][,
     ratio := ifelse(ratio == Inf, max(ratio[is.finite(ratio)]), ratio)][,
     # scale up (I chose a scaling manually to get a prettier graph)
     # and convert to integer and change h
     as.integer(ratio*10)] -> h@count

plot(h)
library(hexbin)
library(plyr)
x=rnorm(10000)
y=rnorm(10000)
#generate hexbin object with IDs=TRUE
#the object includes then a slot with a vector cID
#cID maps point (x[i],y[i]) to cell number cID[i]
HexObj=hexbin(x,y,IDs = TRUE)

#find count statistics for first 2000 points (class 1) and the rest (class 2)
CountDF=merge(count(HexObj@cID[1:2000]),
              count(HexObj@cID[2001:length(x)]),
              by="x",
              all=TRUE
             )
#replace NAs by 0
CountDF[is.na(CountDF)]=0
#check if all points are included
sum(CountDF$freq.x)+sum(CountDF$freq.y)
hexbin只是一个二维直方图。因此,它计算落入给定箱子中的点的数量。我不认为它可以处理您的情况中的非整数数据。
cID排序以正确匹配六边形单元格 - 我编辑了答案来修复这个问题(使用keyby而不是by)。 - eddi