如何在Ubuntu上查看我的磁盘活动?例如,我如何监控正在从磁盘读写的内容以及磁盘使用率的百分比?
我正在寻找类似于Windows资源监视器的应用程序。
我正在寻找类似于Windows资源监视器的应用程序。
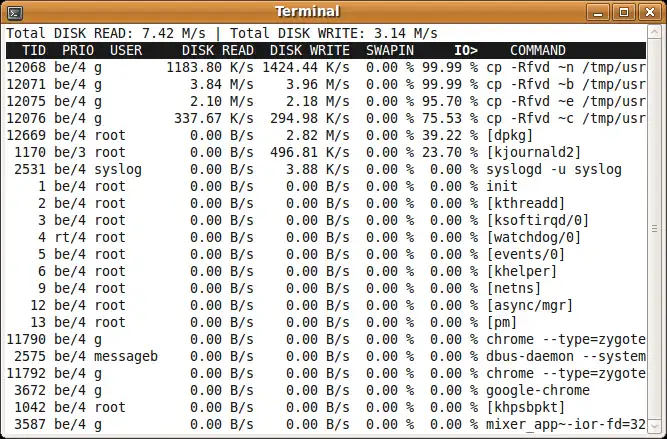
sudo apt-get install iotop
sudo iotop
sudo apt-get install htop
htop
sudo htop

peek,它通过 ffmpg 将 iotop 的输出录制成 .gif 吗? - WinEunuuchs2Unixdf -h -t ext4。这个命令以人类可读的格式打印出来(-h),并假设您正在使用ext4格式(-t ext4)。 - mchidsudo iotop $(echo $(ps -A | grep -v ffmpeg | grep -v peek | awk '{print $1}') | sed 's/ / -p /g;s/PID//g') - mchidhtop中看到“它之前是7%繁忙,现在是23%”。它没有显示我需要的信息来决定是否需要更快的硬盘来提高我的工作效率。 - Serhyi Vynohradovsudo apt install htop
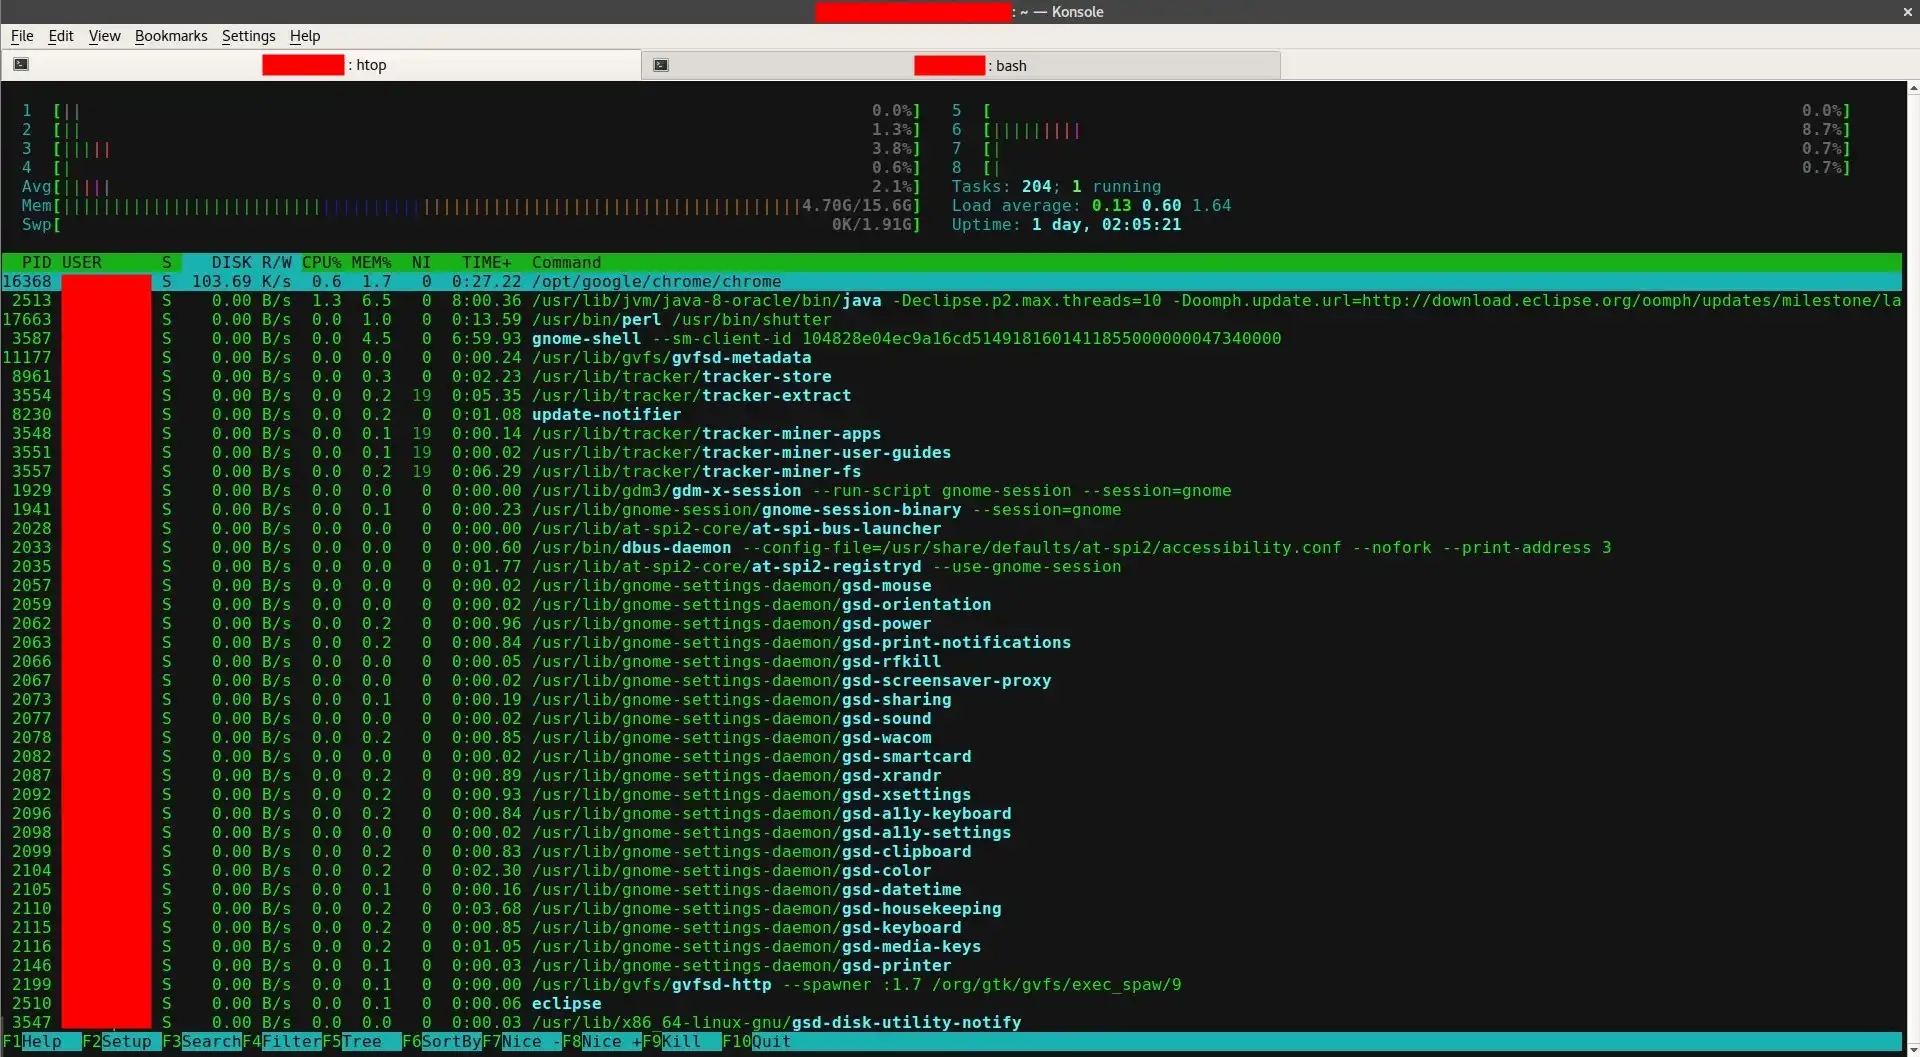
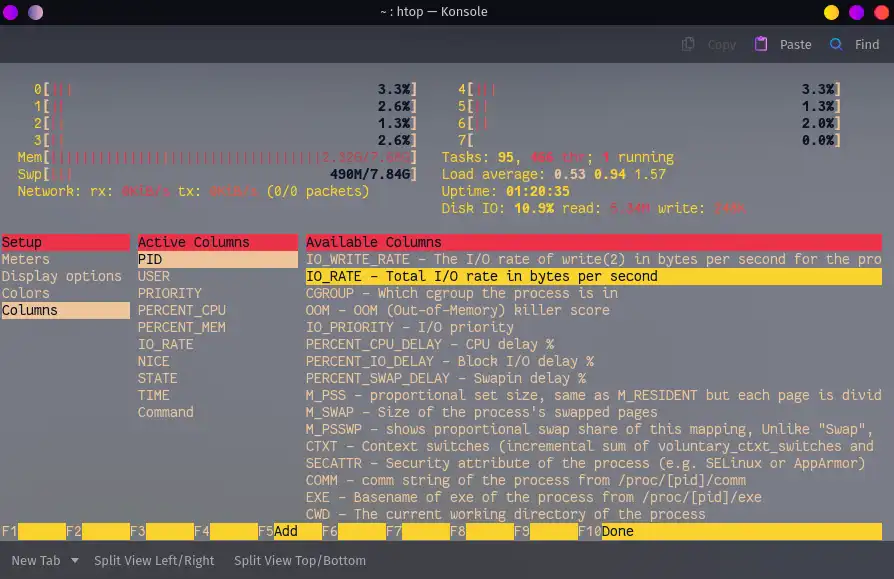
IO_RATE列时,会出现DISK R/W。IO_RATE是每秒字节的总输入/输出(读取和写入)量。 - RedEyedsudo apt-get install nmon
nmon
以下是输出结果:
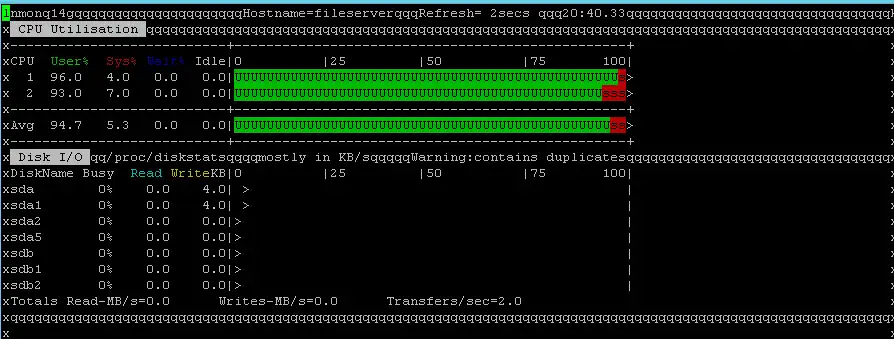
Press d = Disk | Press c = CPU Info |Press r = RAM info | Press q = to exit
dstat 程序。要安装它,只需在终端中执行该命令。sudo apt-get install dstat
dstat命令,您将获得一个完整的实时CPU/网络/磁盘活动监视视图,如下所示。mas@mas-laptop:~ > dstat
You did not select any stats, using -cdngy by default.
----total-cpu-usage---- -dsk/total- -net/total- ---paging-- ---system--
usr sys idl wai hiq siq| read writ| recv send| in out | int csw
15 5 76 4 0 0| 181k 177k| 0 0 | 0 61B|1651 3609
5 0 95 0 0 0| 0 0 | 162B 1064B| 0 0 | 500 994
15 4 77 4 0 0| 0 292k| 302B 52B| 0 0 | 687 1919
6 1 92 1 0 0| 0 0 | 0 0 | 0 0 | 496 1089
5 1 94 1 0 1| 0 0 | 0 0 | 0 0 | 422 919
6 1 93 1 0 0| 0 0 | 0 0 | 0 0 | 517 1181
9 2 89 1 0 1| 0 0 | 0 0 | 0 0 | 494 1066
dstat --disk --fs --load命令。下面是一个示例输出。$ dstat --disk --fs
-dsk/total- --filesystem- ---load-avg---
read writ|files inodes| 1m 5m 15m
895k 186k|13728 100k|0.63 0.73 0.84
0 0 |13728 100k|0.63 0.73 0.84
0 0 |13728 100k|0.63 0.73 0.84
0 0 |13728 100k|0.63 0.73 0.84
0 12k|13728 100k|0.66 0.74 0.84
0 0 |13728 100k|0.66 0.74 0.84
0 0 |13728 100k|0.66 0.74 0.84
0 0 |13728 100k|0.66 0.74 0.84
0 0 |13728 100k|0.66 0.74 0.84^C
dstat --help具有以下信息:
Usage: dstat [-afv] [options..] [delay [count]]
Versatile tool for generating system resource statistics

Dstat options:
  -c, --cpu              enable cpu stats
     -C 0,3,total           include cpu0, cpu3 and total
  -d, --disk             enable disk stats
     -D total,hda           include hda and total
  -g, --page             enable page stats
  -i, --int              enable interrupt stats
     -I 5,eth2              include int5 and interrupt used by eth2
  -l, --load             enable load stats
  -m, --mem              enable memory stats
  -n, --net              enable network stats
     -N eth1,total          include eth1 and total
  -p, --proc             enable process stats
  -r, --io               enable io stats (I/O requests completed)
  -s, --swap             enable swap stats
     -S swap1,total         include swap1 and total
  -t, --time             enable time/date output
  -T, --epoch            enable time counter (seconds since epoch)
  -y, --sys              enable system stats

  --aio                  enable aio stats
  --fs, --filesystem     enable fs stats
  --ipc                  enable ipc stats
  --lock                 enable lock stats
  --raw                  enable raw stats
  --socket               enable socket stats
  --tcp                  enable tcp stats
  --udp                  enable udp stats
  --unix                 enable unix stats
  --vm                   enable vm stats

  --plugin-name          enable plugins by plugin name (see manual)
  --list                 list all available plugins

  -a, --all              equals -cdngy (default)
  -f, --full             automatically expand -C, -D, -I, -N and -S lists
  -v, --vmstat           equals -pmgdsc -D total

  --float                force float values on screen
  --integer              force integer values on screen

  --bw, --blackonwhite   change colors for white background terminal
  --nocolor              disable colors (implies --noupdate)
  --noheaders            disable repetitive headers
  --noupdate             disable intermediate updates
  --output file          write CSV output to file

delay is the delay in seconds between each update (default: 1)
count is the number of updates to display before exiting (default: unlimited)
关于这个工具的更多信息,请查看以下链接:
sudo apt install htop
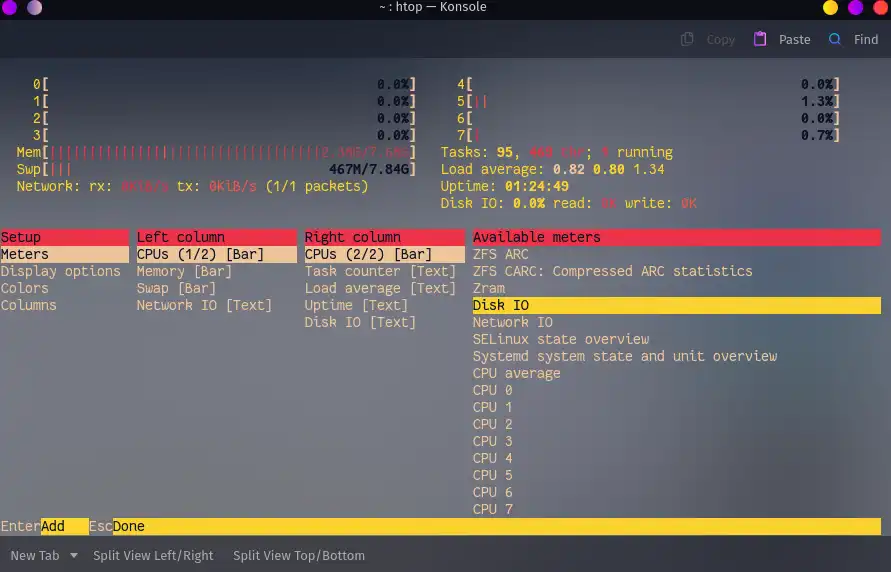
如上面由RedEyed回答的那样,如果你想要查看每个进程的读写速度(以字节/秒为单位),请按照以下步骤操作:设置(F2) --> 列 --> 可用列 --> 选择IO_RATE(如下图所示)
